MARKET MOVERS
Cross-Chain Bridges Tokens Lead Today's Crypto Movers · Oct 1, 2026
By TraderWe· Published Oct 1, 2026· 💬 0
Contents
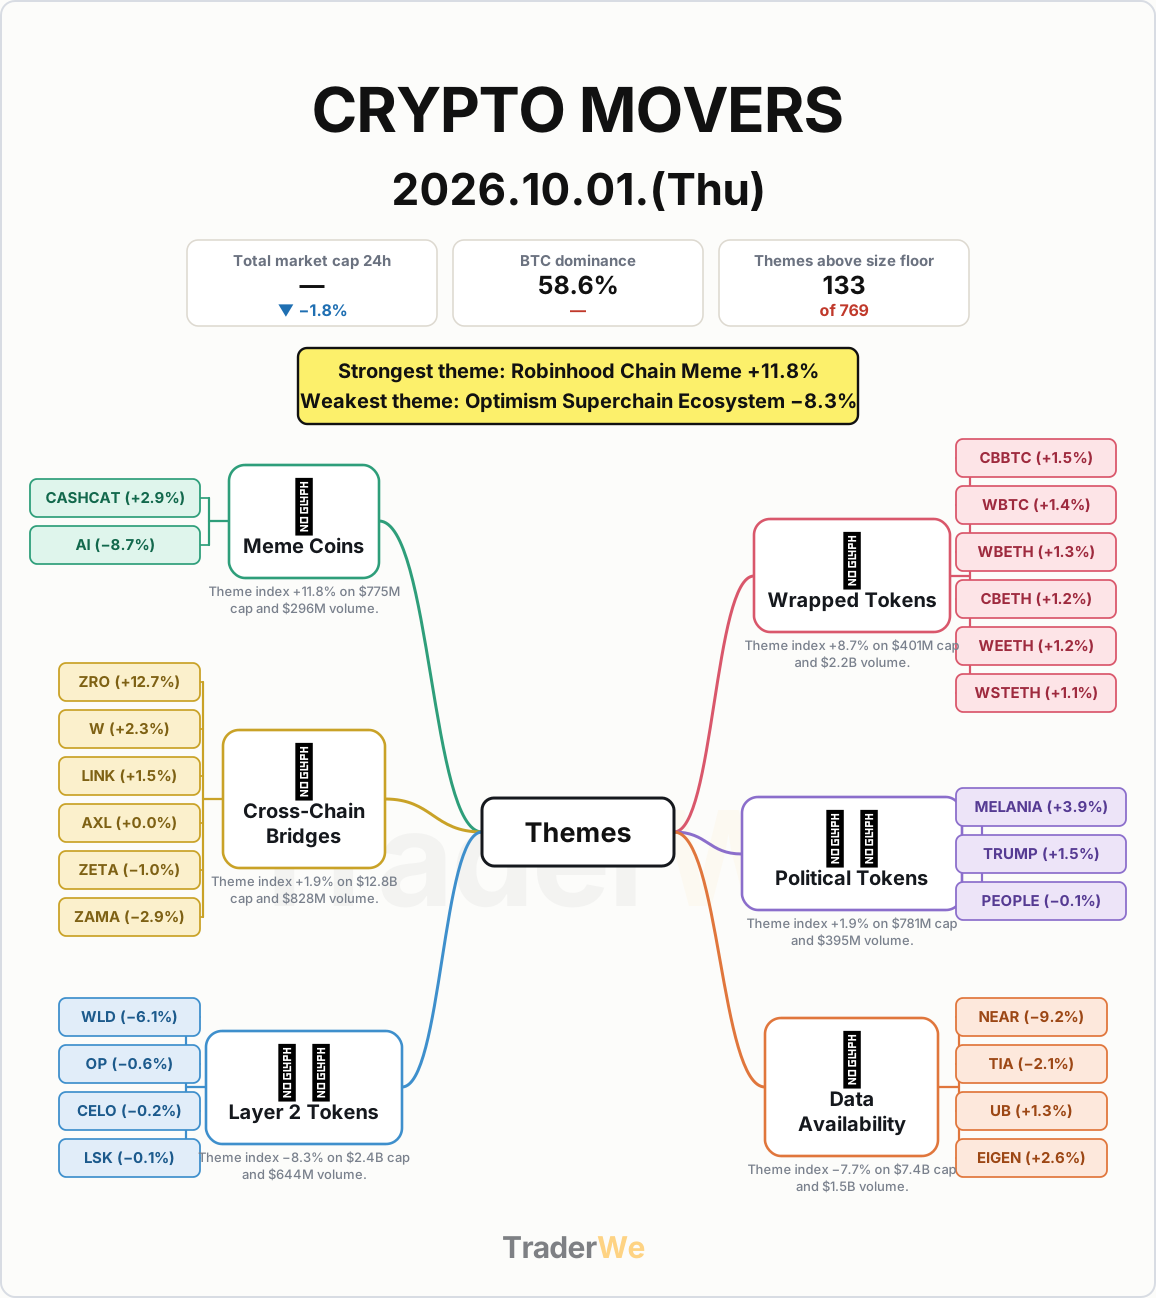
Which crypto tokens moved most over the last 24 hours as of October 1, 2026, and the themes that drove them.
1. Market at a glance
- Total market cap 24h — ▼ −1.8%
- BTC dominance 58.6% —
- Themes above size floor 133 of 7692. Biggest movers, grouped by what drove them
🎭 Meme Coins *(grouped from the “Robinhood Chain Meme” category)* — Theme index +11.8% on $775M cap and $296M volume.
- CASHCAT +2.9% — Cash Cat
- AI −8.7% — Artificial Inu
📦 Wrapped Tokens *(grouped from the “Crypto-Backed Tokens” category)* — Theme index +8.7% on $401M cap and $2.2B volume.
- CBBTC +1.5% — Coinbase Wrapped BTC
- WBTC +1.4% — Wrapped Bitcoin
- WBETH +1.3% — Wrapped Beacon ETH
- CBETH +1.2% — Coinbase Wrapped Staked ETH
- WEETH +1.2% — Wrapped eETH
- WSTETH +1.1% — Wrapped stETH
🌉 Cross-Chain Bridges *(grouped from the “Cross-chain Communication” category)* — Theme index +1.9% on $12.8B cap and $828M volume.
- ZRO +12.7% — LayerZero
- W +2.3% — Wormhole
- LINK +1.5% — Chainlink
- AXL +0.0% — Axelar
- ZETA −1.0% — ZetaChain
- ZAMA −2.9% — Zama
🗳️ Political Tokens *(grouped from the “PolitiFi” category)* — Theme index +1.9% on $781M cap and $395M volume.
- MELANIA +3.9% — Melania Meme
- TRUMP +1.5% — Official Trump
- PEOPLE −0.1% — ConstitutionDAO
⛓️ Layer 2 Tokens *(grouped from the “Optimism Superchain Ecosystem” category)* — Theme index −8.3% on $2.4B cap and $644M volume.
- WLD −6.1% — Worldcoin
- OP −0.6% — Optimism
- CELO −0.2% — Celo
- LSK −0.1% — Lisk
💾 Data Availability — Theme index −7.7% on $7.4B cap and $1.5B volume.
- NEAR −9.2% — NEAR Protocol
- TIA −2.1% — Celestia
- UB +1.3% — Unibase
- EIGEN +2.6% — EigenCloud (prev. EigenLayer)3. What drove the upside
- Robinhood Chain Meme +11.8% — led by CASHCAT +2.9%
- Crypto-Backed Tokens +8.7% — led by CBBTC +1.5%
- Cross-chain Communication +1.9% — led by ZRO +12.7%4. What weighed on it
- Optimism Superchain Ecosystem −8.3% — WLD −6.1%
- Data Availability −7.7% — NEAR −9.2%5. How this was built
636 of 769 categories were below the size floor ($300M cap, $50M volume) and were dropped. Without that filter, dead micro-cap baskets print percentage moves in the billions and top the list.
Every number here comes from market data. The theme names and the one-line explanations are written from the day's headlines — where a group moved with no headline behind it, we say so rather than inventing a reason.
This is an observation of what moved, not advice and not a recommendation. This tells you where attention went today; it does not tell you what happens next.