How Accurate Is Float Data? SEC Filings vs a Data Vendor
By TraderWe· Published Oct 26, 2026· Updated Oct 26, 2026· 💬 0
Study details
Measured
3,931 US-listed symbols that had a float from both sources on October 26, 2026
Instruments
a float estimate built from SEC filings, and the free float published by a widely used commercial market data API, taken the same day
Method
compute float from public filings for every company we can match to an SEC registrant, pull the vendor's float for every symbol it covers, and measure the gap symbol by symbol. Group the gaps by size, by how the insider holdings were counted, and by whether a common low-float cutoff gives the same answer
Result
the two sources agree within 10% on 55.9% of symbols and differ by more than 25% on 23.7%. The gap grows as the float shrinks, from a median of 0.9% above 250 million shares to 17.4% under 10 million. A 10-million-share low-float cutoff gives a different answer on 232 symbols
Float is the number of shares that can actually trade: shares outstanding minus the ones held by insiders and by large owners who are not going to sell. Small-cap traders lean on it harder than on almost any other fundamental number, because a stock with a small float can move a long way on modest volume. Scanners filter on it, chat rooms quote it, and a low-float tag next to a ticker is treated as a fact.
It is not a fact. It is an estimate, and different sources estimate it differently. To see how accurate a float number really is, and how differently two sources arrive at it, we built our own float from SEC filings and set it next to the free float published by a commercial market data API, for every symbol both of them cover. This article reports where the two numbers agree, where they do not, and what that means if you trade off a float filter.
1. How each number is built
Neither number is observed directly. Both start from shares outstanding and subtract the holders who are assumed not to trade.
Our SEC estimate takes shares outstanding from the cover of the latest 10-Q or 10-K, falls back to the balance sheet when the cover is missing, and uses a 424B prospectus when an offering has been filed after the last quarterly report. Share counts older than 15 months are discarded. From that we subtract officers and directors, taken from the beneficial ownership table in the annual proxy statement where one exists, updated by any Form 4 insider filings made after it, and from Form 4 filings alone where there is no proxy table. Holders of 5% or more are subtracted when they file as active owners. Passive holders that file a Schedule 13G, and large index managers, are not subtracted unless they hold 10% or more, on the view that their shares do trade.
The vendor does not publish its method in that detail, and it does not have to agree with ours. What it does publish is an effective date for each value, which we use below.
So this is a comparison of two estimates, not a test of one against the truth. Where they differ, either one could be closer.
2. Coverage before accuracy
The vendor had a float for 6,972 symbols. Our SEC run covered 5,500 companies and produced a float for 4,057. Both sources had a value for 3,931 symbols, and everything below is measured on those.
Most of the gap in coverage is on our side and is structural. 1,687 of the vendor's symbols could not be matched to an SEC registrant at all. That group includes depositary receipts of foreign companies, funds, and other securities that do not file quarterly reports. Another 1,182 matched a registrant but had no share count on file that we could read, which happens with issuers that file annual reports only and when the share count is not tagged in the filing. The remaining 172 came out at zero: the holders subtracted added up to the whole share count, which says more about how those ownership tables were parsed than about the company, so we do not publish them.
If you trade foreign listings, a filing-based float will often simply not exist, and a vendor number for those symbols is coming from somewhere other than quarterly filings.
3. How far apart the two numbers are
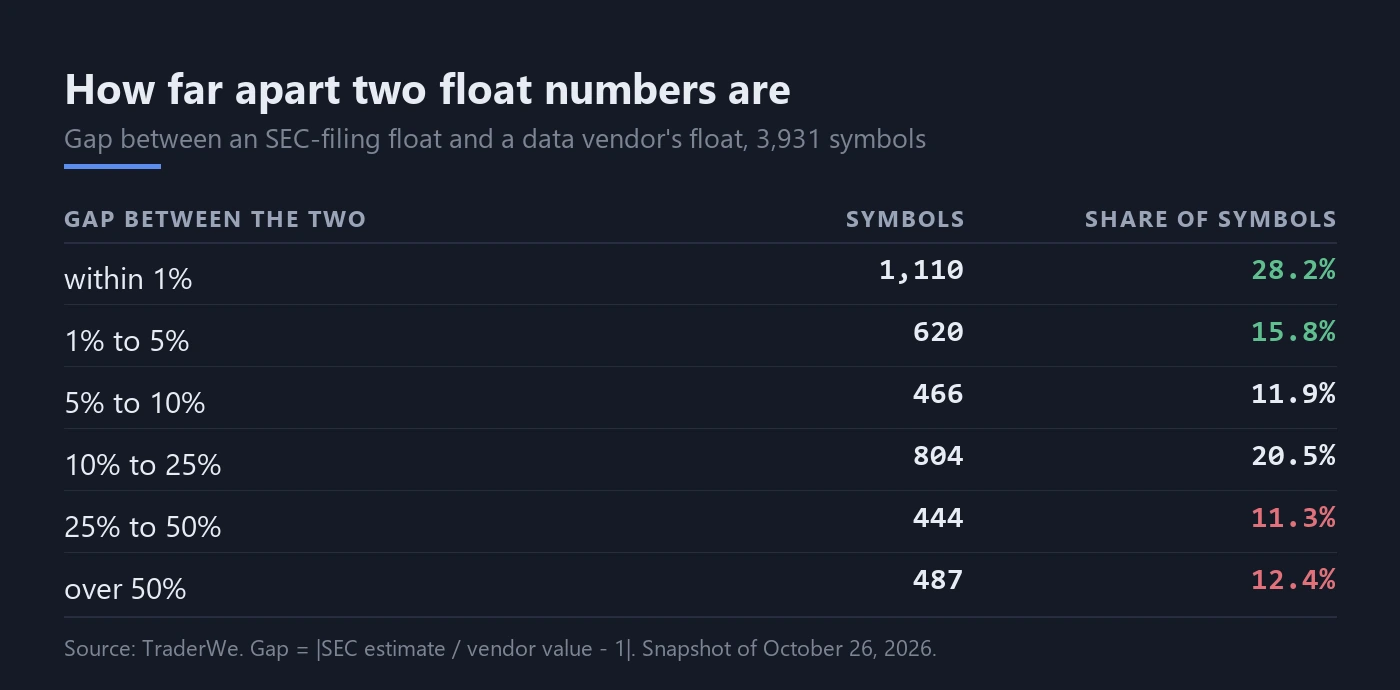
On the 3,931 symbols with both values, the median gap is 7.4%. Half the symbols are within that distance and half are further apart.
28.2% of symbols agree within 1%, which is what you would expect when both sources read the same share count and subtract roughly the same holders. 55.9% agree within 10%. Then the tail opens up: 23.7% differ by more than 25%, and 12.4% differ by more than 50%. A quarter of the symbols are off by 23.9% or more, and a tenth by 61.1% or more.
The gaps run in both directions. The SEC estimate is higher than the vendor's by more than 1% on 39.5% of symbols and lower by more than 1% on 32.2%. Neither source is systematically the conservative one.
4. The smaller the float, the bigger the gap
The disagreement is not spread evenly. It concentrates exactly where traders use float most.
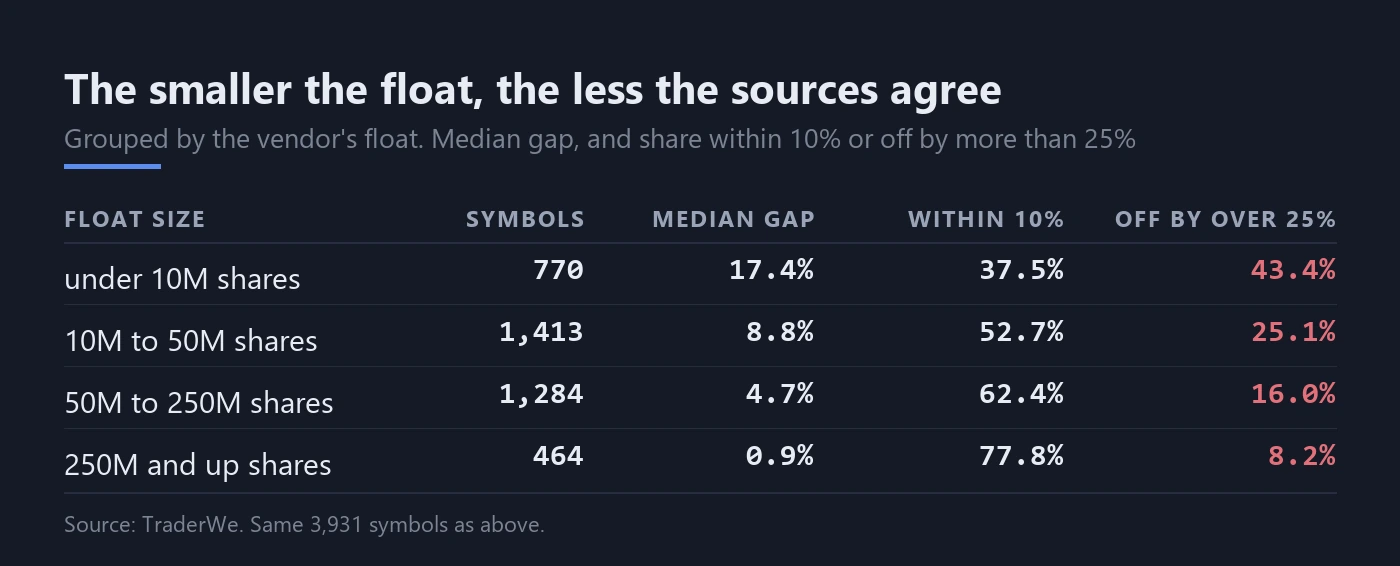
Above 250 million shares the median gap is 0.9%, and 77.8% of symbols agree within 10%. Between 10 and 50 million shares the median gap is 8.8% and a quarter of symbols are off by more than 25%. Under 10 million shares the median gap is 17.4%, only 37.5% agree within 10%, and 43.4% are off by more than 25%.
Part of the reason is arithmetic. In a large company, a few insiders' holdings are a rounding error against the share count, so any reasonable method lands close to any other. In a small company, a single holder can own a quarter of the shares, and whether that holder is subtracted, and whether a recent offering is counted yet, decides the answer. Small caps also issue shares more often, so a share count that is three months old can be meaningfully wrong.
How insiders were counted matters too. Where our estimate used the proxy ownership table, the median gap to the vendor was 9.8% across 2,030 symbols. Where it relied on insider filings alone, the median gap was 4.9% across 1,901 symbols. The direction differs too. With the proxy table, the SEC estimate came out lower than the vendor's by more than 1% on 41.9% of symbols and higher on 33.2%. With insider filings alone, it was lower on 21.9% and higher on 46.3%. The proxy table names holders, such as 5% owners, who never file a Form 4, so it subtracts more, and that is consistent with the estimate landing below the vendor more often when the table is used.
5. Is it low float? Depends who you ask
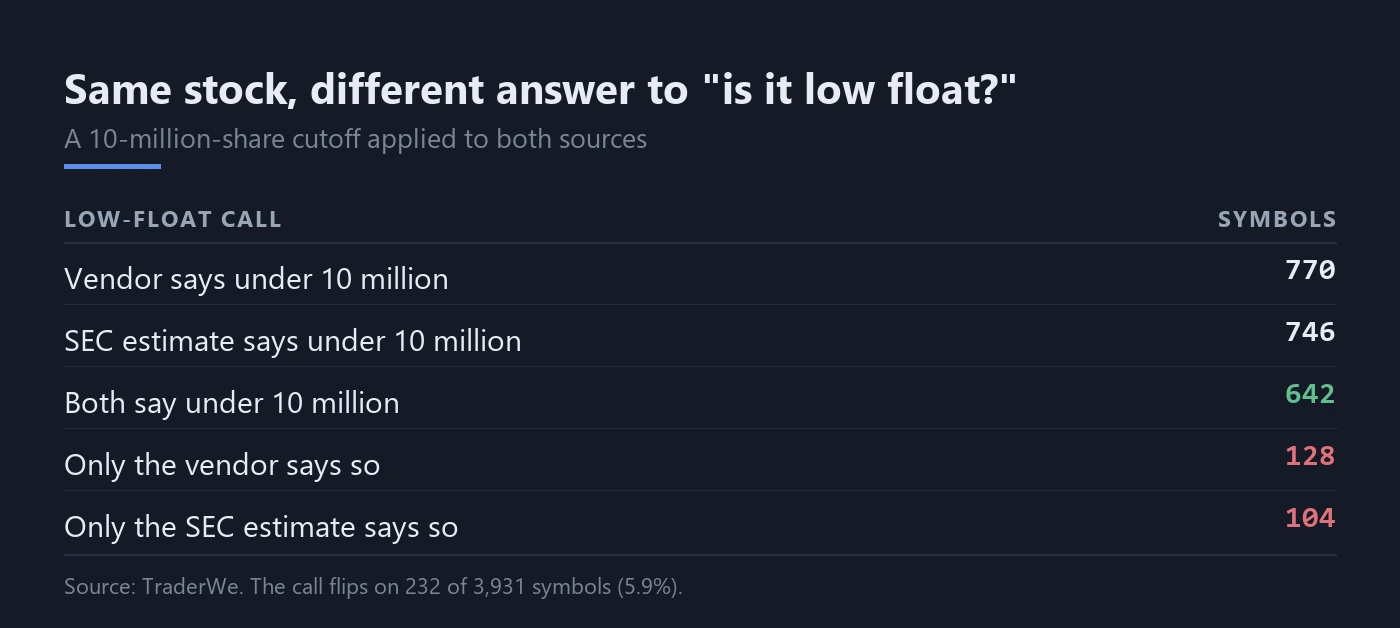
Many screens use a hard cutoff. We applied a 10-million-share cutoff to both sources to see how often the answer changes.
The vendor puts 770 of the 3,931 symbols under 10 million shares. The SEC estimate puts 746 there. Only 642 are under the cutoff in both. So 128 of the vendor's low-float names are not low float on the SEC count, and 104 names are low float only on the SEC count. Overall the call flips on 232 symbols, 5.9% of the sample, and 16.6% of the vendor's own low-float list.
That 16.6% is the practical number. If your scanner shows a low-float tag, roughly one in six of those tags would disappear if the float came from a different, equally defensible source.
6. Is one of them just out of date?
The obvious explanation for a large gap is that one source has an old share count. The dates do not support that as the main cause.
Among the 931 symbols where the two numbers differ by more than 25%, the SEC share count was newer than the vendor's effective date on 185, or 19.9%. On the other four in five, the vendor's value was as recent or more recent and the numbers still disagreed, which suggests the subtraction step, who counts as an insider or a holder who will not sell, matters more than stale data. The direction is split as well: the SEC estimate was the larger of the two on 503 of the 931 and the smaller on 428.
Staleness is still real on both sides. The median age of the vendor's effective date was 71 days and the median age of our share count was 87 days. 3.6% of the vendor's values and 14.6% of our share counts were more than 180 days old.
7. What to do with a float number
Treat float as a range, not a point, and the smaller it is the wider the range. For a stock with tens of millions of shares or more, any reputable source is close enough. Under 10 million shares, assume the true figure could be a quarter higher or lower than what your screen says, and check the latest 10-Q cover, any prospectus filed since, and the proxy ownership table before you size a trade around it.
Check the date. A float with an effective date months before a known offering is wrong by the size of the offering.
And be wary of hard cutoffs. A filter that drops everything above 10 million shares is drawing a sharp line through a fuzzy number, and on this sample it would have included or excluded 232 stocks depending only on which source fed it.
8. What this does not establish
It does not say which source is right. Neither is ground truth, and checking a sample of disagreements by hand against the filings would be the next step. It is a single-day snapshot, and floats move with every offering, buyback and insider sale. The SEC estimate cannot see holdings that are never filed, such as shares under lock-up agreements that are only described in prospectus text, and the vendor's method is not public. The sample excludes most foreign listings and funds, which is where filing-based floats do not exist at all.
Originally published by TraderWe on October 26, 2026. You may quote and link to this page. Republishing the full text without a link back to the original is not permitted.