Before trusting any entry, run this. It's a deliberately uninformative entry with a sensible exit.
1. The rule
# BUY — enters on almost nothing, on purpose
if HhmmSs >= 100000 and HhmmSs <= 140000 and DayAmount > 5000000:
    if RisingStreak(5):
        Buy()
# SELL
if ProfitPct >= 2.0 or ProfitPct <= -1.0 or HoldTime >= 1200:
Sell()Whatever this produces on your universe is the bar. If your clever entry doesn't clearly beat it after costs, your edge is in the exit rules, not the entry. Which is useful to know and much cheaper to find out now.
2. Why a deliberately weak baseline is useful
This entry is close to random on purpose. It waits for a mild rising streak inside the quiet
part of the day on a name that trades enough to exit. It should not have an edge.
That is what makes it useful. When your real strategy produces a result, the first question is
whether the result comes from your idea or from the market simply moving. Running this baseline
over the same period answers it. If your strategy and this one produce similar numbers, the
market did the work.
3. When this baseline looks good
In a strongly trending sample, this will look profitable — and so will almost anything else
that buys. That is the signal to widen your test period rather than to trade it.
4. What to change first
Nothing. Changing the baseline defeats its purpose. Keep it exactly as written and run it
alongside every strategy you test.
5. What the round trip asks of it
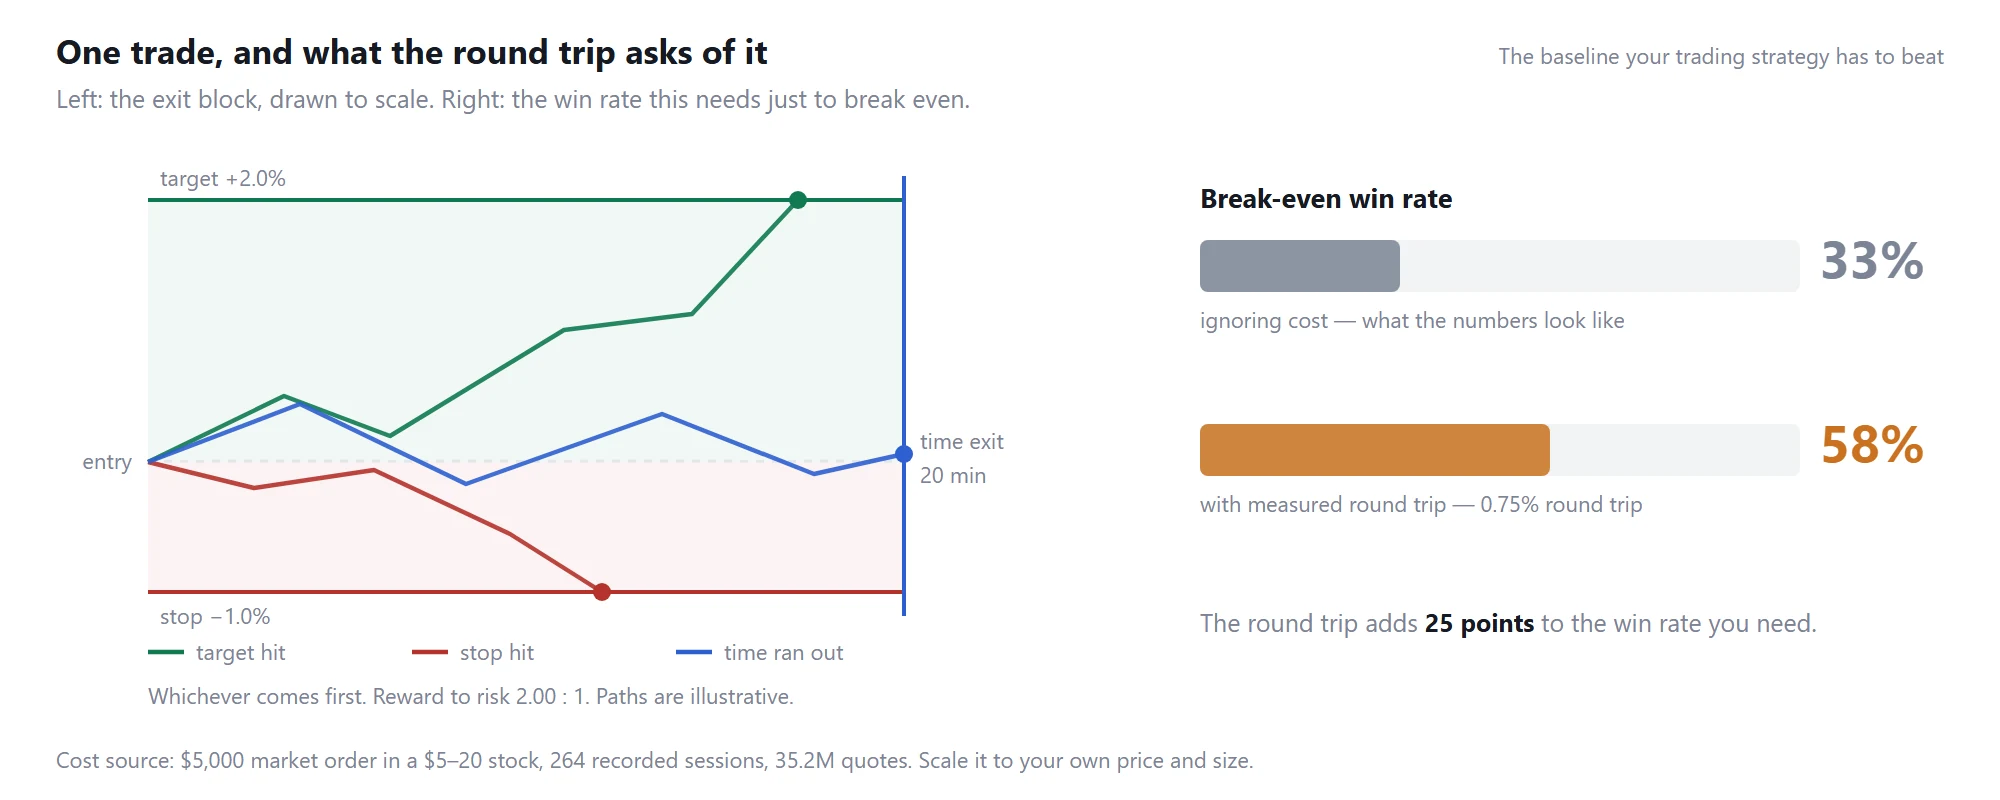
The baseline your trading strategy has to beat: the exit block drawn to scale, and the break-even win rate before and after measured trading costs
A baseline has to include the toll, or it is not a baseline.
The 2.0% / 1.0% structure needs 33% ignoring cost and 58% with the measured 0.75% round trip.
Any strategy you write later is competing against that second number, not the first.
This is the most common way a promising idea dies: it beats the naive baseline and loses to the
honest one. Before you compare anything, price both at the same cost — we measured what one tick of
slippage does to a real model, and it removed 44% of the edge
(slippage vs backtest edge).
Educational template for research and backtesting. Not investment advice and not a signal service.
Originally published by TraderWe on July 2, 2026. You may quote and link to this page. Republishing the full text without a link back to the original is not permitted.
Ran mine against this last month and honestly the 2%/-1% exit was doing most of the lifting in my "momentum" setup! Ouch. Kept the exit, threw out the entry.
Dave's word "unpleasant" is the honest part. How did you sit with that for a few days before touching anything? I find the urge to immediately re-optimise is the real thing to watch, not the result itself.