Momentum, but only when volume agrees. The filter is the whole point — without it this fires on
every drift.
1. The rule
# BUY
if ChangeAngle(60) > 25 and Strength > 125:
    if SumBuyVol(60) > SumSellVol(60) * 1.5:
        Buy()
# SELL
if ProfitPct >= 2.5 or ProfitPct <= -1.2 or HoldTime >= 900:
Sell()
2. Two different questions about the same minute
Strength is cumulative since the session opened. SumBuyVol(60) and SumSellVol(60) cover the
last sixty seconds only. They are not redundant — they ask different questions.
Condition
Time frame
Asks
Strength > 125
since the open
have buyers been in control all day?
SumBuyVol(60) > SumSellVol(60) * 1.5
last 60 seconds
are they in control right now?
Requiring both means the move has context as well as immediacy. A name can be strong all day and
be selling off this minute, and that is exactly the entry you want to skip.
The 1.5 ratio is arbitrary and worth wiggle-testing before you trust it. So is 125 — see
the same entry at three sensitivities
for how to do that without fooling yourself.
3. Careful with the angle
ChangeAngle(60) > 25 is in degrees, so 25 over a short window and 25 over a long one are
completely different asks. The window is short here on purpose. Stretch it out and leave the angle
where it is, and the entry basically stops firing — silently, with no error and no trades.
4. What the round trip asks of it
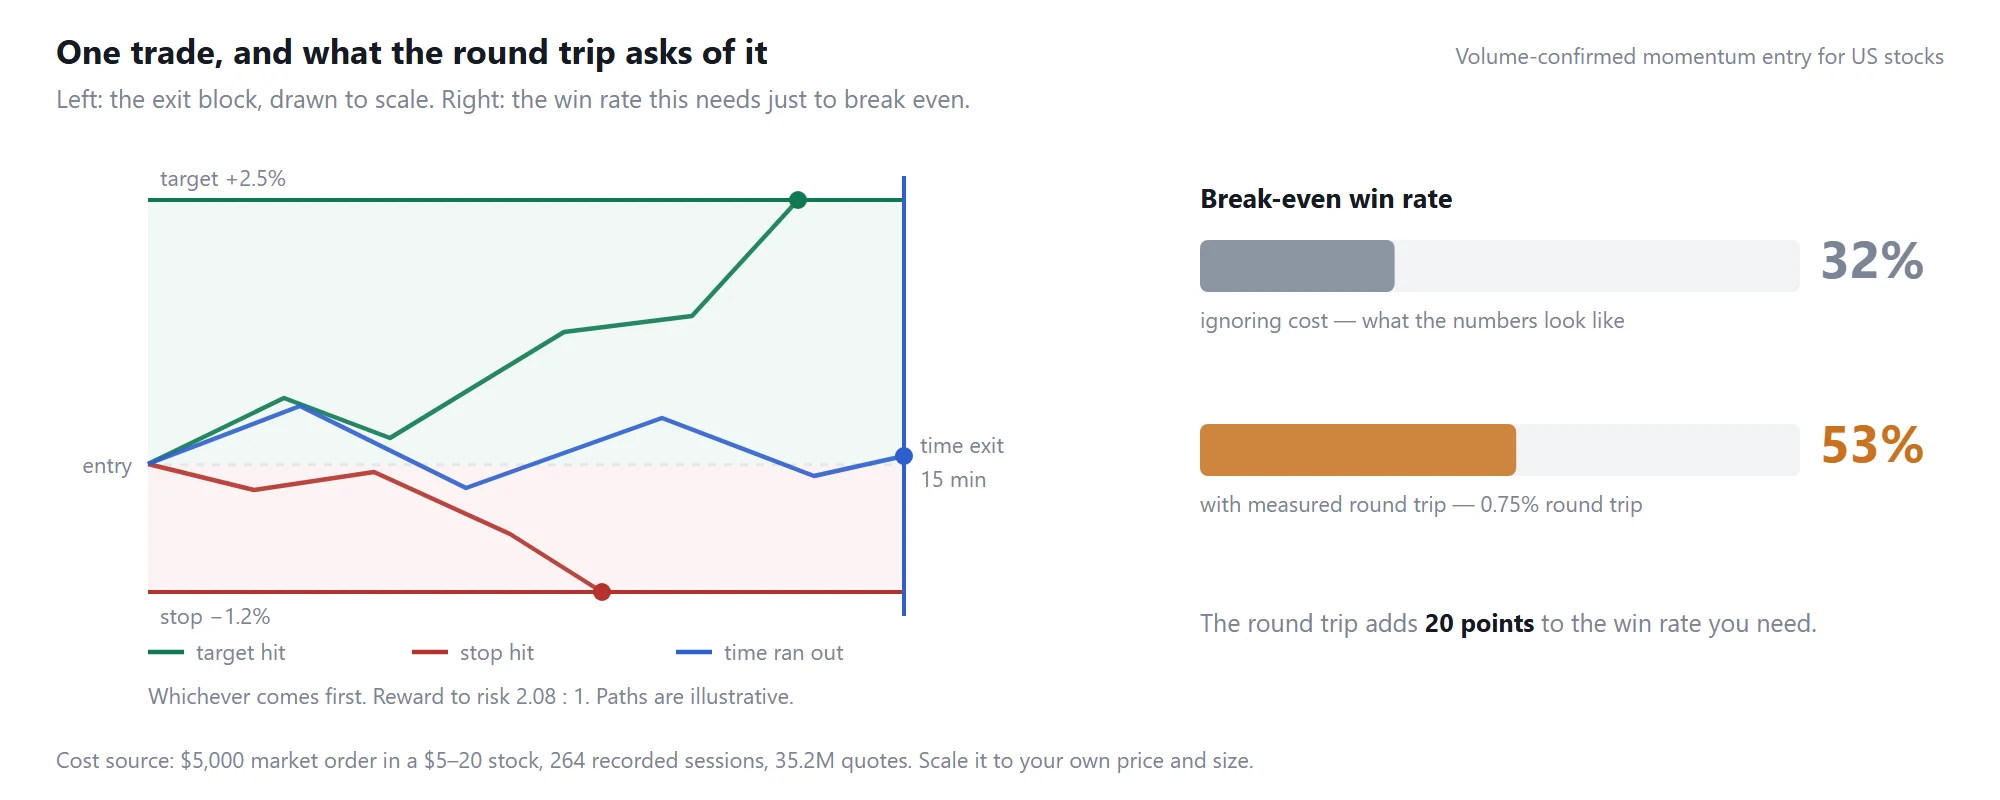
Volume-confirmed momentum: the exit block drawn to scale, and the break-even win rate before and after measured trading costs
The 2.5% target against a 1.2% stop needs 32% on paper and 53% with the measured 0.75% round
trip (what day trading a US stock really costs).
Worth noting what that means for the volume filter: it does not have to make you right more often
in some abstract sense. It has to move you from below 53% to above it. That is a concrete,
testable bar, and it is much more useful than asking whether the filter "helps".
5. What to change first
Run it once with the volume line and once without, on the same entry and the same sessions. If the
filter is doing its job you should see fewer trades and a higher win rate; if you see fewer trades
and the same win rate, it is removing trades at random and you have simply made your sample
smaller. Every factor used here is defined in the
day trading indicators and factors reference.
Educational template for research and backtesting. Not investment advice and not a signal service.
Originally published by TraderWe on July 24, 2026. You may quote and link to this page. Republishing the full text without a link back to the original is not permitted.
The 1.5 ratio is doing two jobs at once here. It filters direction and it filters participation, and those don't necessarily have the same optimal cutoff. My instinct would be to log the SumBuyVol/SumSellVol value at every bar where the angle and strength conditions already pass, then look at the distribution of that ratio rather than picking a level off intuition. If the bulk of your qualifying bars already sit above 1.5, the filter isn't filtering much and the 1.2/2.5 exit is carrying the whole result. Have you looked at how many signals the volume condition actually removes?
ran something close to this on perps and the volume filter is basically the only thing keeping you out of the fake breakouts, so yeah, it IS the strategy. also 900s hold time on a 1s-1m chart is an eternity, half my blowups came from letting a winner sit past its momentum window because i was greedy at 3x
One thing worth doing before wiggle-testing the 1.5: the exit pair sets your required hit rate. Take 2.5% vs stop 1.2% is roughly a 2:1 payoff, so ignoring fees you need to be right about a third of the time to break even — 1/(1+2.08) ≈ 32%. That gives you a clean target to check the volume filter against: if adding the 1.5 ratio doesn't push the win rate meaningfully past that, the filter isn't paying for the trades it's blocking. And the time-based exit muddies it, since those close somewhere between the two, so I'd bucket the exits by type when you measure.