What day trading a US stock really costs: 35 million quotes measured
By TraderWe· Published Aug 16, 2026· Updated Aug 17, 2026· 💬 5
Study details
Measured
2025-04-02 – 2026-07-31, 264 recorded sessions; 35,207,932 quotes
Instruments
US equities, intraday movers; ten levels of book on every quote
Method
walk a market buy against the recorded ask ladder level by level and compare the quantity-weighted fill against the mid; medians over regular trading hours only
Result
a $5,000 market buy in a $5-20 stock pays about 38bp one way. 32.2% of all quotes are already one cent wide, and a $25,000 order could not be filled inside ten levels 28.7% of the time
Every backtest quietly assumes a fill price. Most assume the last trade, some assume the mid, the careful ones subtract a fixed number of basis points. All three are guesses, and the size of the guess decides whether a strategy that looks profitable actually is.
We have 264 recorded US equity sessions with ten levels of order book on every quote. So instead of guessing, we walked the recorded ladder and measured what a market order would have paid.
The headline: a $5,000 market order in a $5 to $20 stock pays about 38 basis points against the mid, one way. Round trip, that is roughly 0.75% of movement you need before the trade breaks even — before commission, before being right about direction.
1. What we measured
Three quantities, defined exactly so you can reproduce them.
Spread.(Ask1 - Bid1) divided by the mid, in basis points. This is the full round-trip cost if you cross the spread in both directions and your size never leaves the top level.
Walk cost. For a market buy of $X, fill against the recorded ask levels one through ten in order, take the quantity-weighted average price, and compare it to the mid. One way, in basis points. If ten levels cannot absorb $X, the quote counts as unfilled and is excluded from the cost median.
Minimum-tick share. The fraction of quotes where the spread is one cent or less, meaning no tighter quote exists.
All of it on regular trading hours only, 09:30 to 16:00 Eastern, on quotes where both sides are populated and the ask is not below the bid. All medians rather than means — a handful of blown-out quotes dominates an average and tells you nothing about the trade you are actually going to place.
The sample is 264 sessions from 2025-04-02 to 2026-07-31, and 35,207,932 quotes.
2. The spread, by hour and price
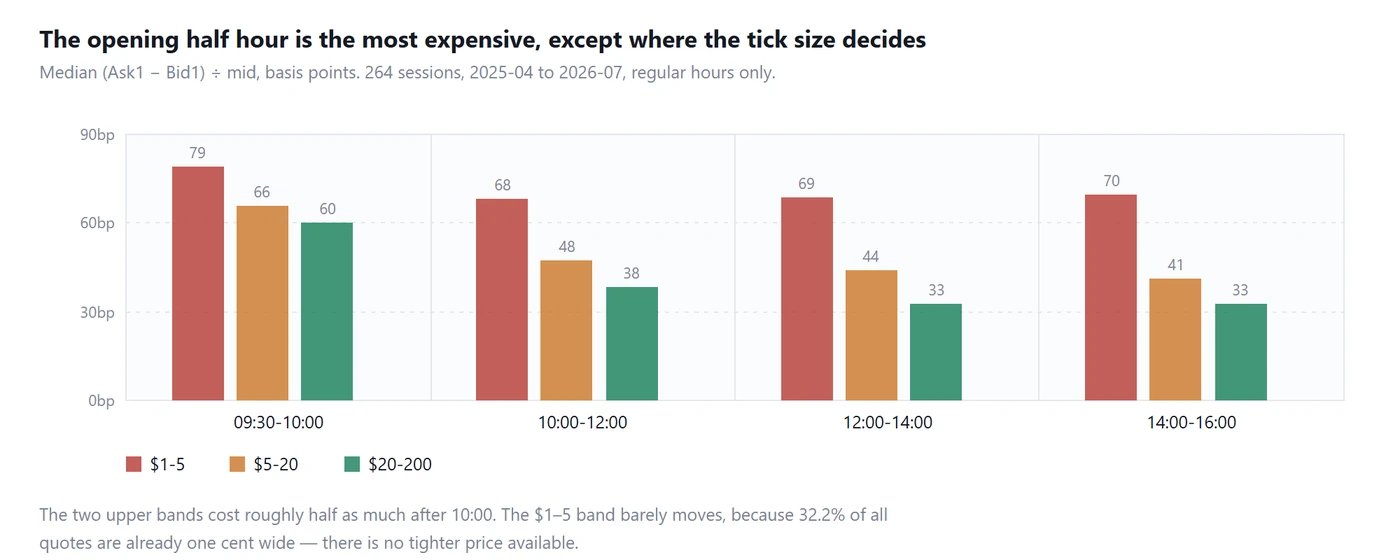
Median spread by time of day and price band across 264 recorded sessions
$1-5
$5-20
$20-200
09:30-10:00
79bp
66bp
60bp
10:00-12:00
68bp
48bp
38bp
12:00-14:00
69bp
44bp
33bp
14:00-16:00
70bp
41bp
33bp
Two of the three bands behave the way you would expect and one does not.
For $5 to $20 and $20 to $200 names, the opening half hour costs roughly 1.6 to 1.8 times what the afternoon costs. That is the same half hour in which most day trading strategies are written to operate, and it is worth sitting with: the period with the most movement is also the period where you hand back the most of it on entry and exit.
The $1 to $5 band does not improve at all. It starts at 79bp and finishes at 70bp, and nothing in between helps.
3. A third of all quotes are already as tight as they can be
The reason the cheap band never gets cheaper is the tick size. 32.2% of all 35 million quotes have a spread of one cent or less. For those, there is no tighter price the market could offer.
One cent on a $1.50 stock is 67 basis points. On a $3 stock it is 33. On a $150 stock it is under one. The same minimum tick is a rounding error at the top of the price range and a wall at the bottom.
This has a direct consequence that gets missed constantly. A strategy targeting a 0.5% move is perfectly sensible on a $50 stock and structurally impossible on a $1.50 one, because a third of the time the quote is already one cent wide, and that one cent alone is a 0.67% round trip. No amount of parameter tuning changes that; it is arithmetic about the minimum price increment.
4. Size is the multiplier
The spread is what the top level costs. It is not what your order costs, because your order is usually bigger than the top level.
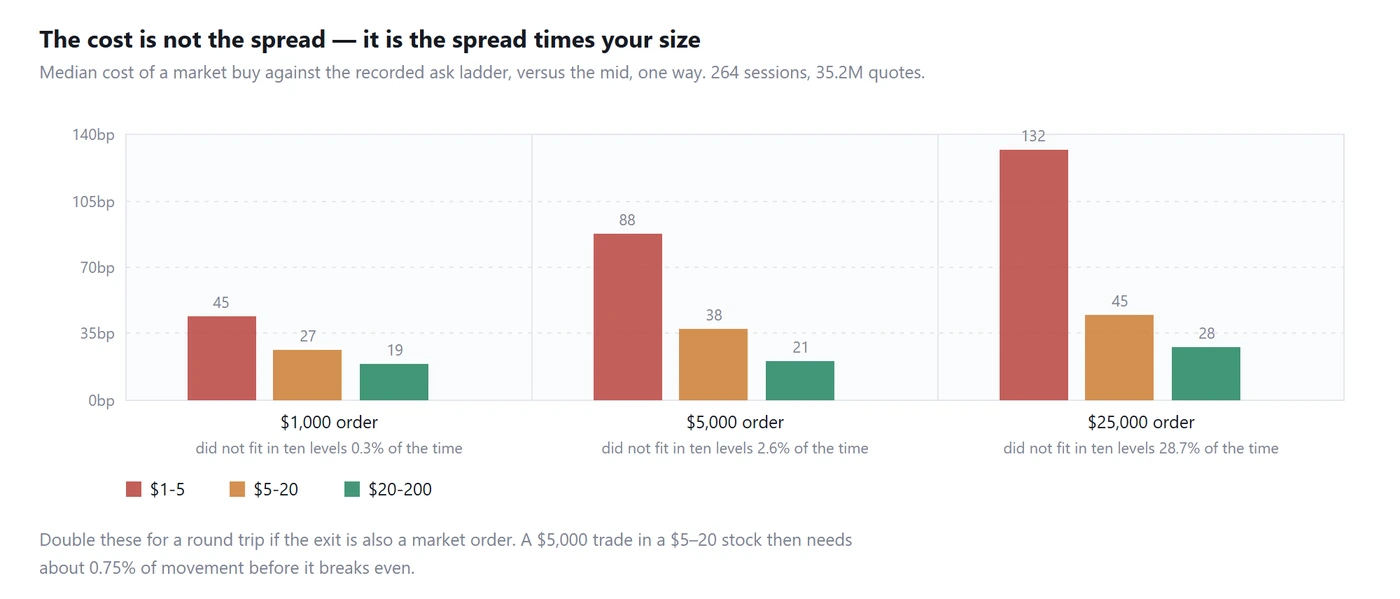
Median cost of a market buy by order size and price band, walked against the recorded ask ladder
Order
$1-5
$5-20
$20-200
$1,000
45bp
27bp
19bp
$5,000
88bp
38bp
21bp
$25,000
132bp
45bp
28bp
Read the columns rather than the rows. In the $20 to $200 band, going from a $1,000 order to a $25,000 order costs you an extra 9 basis points. The book is deep enough that size barely matters. In the $1 to $5 band the same increase in size triples the cost, from 45bp to 132bp.
That is the trade-off nobody puts in a backtest. Cheap stocks look attractive because they move, and they are the ones where your size is punished hardest.
Double any of these for a round trip, on the assumption that your exit is also a market order and the bid side looks like the ask side. We measured the ask side; the doubling is an assumption, not a measurement.
5. The order that does not fit
The cost table above is conditional on the order filling at all. It often does not.
Order size
Could not be filled within ten levels
$1,000
0.3%
$5,000
2.6%
$25,000
28.7%
More than a quarter of the time, a $25,000 market order exhausts the entire recorded ten-level ladder. What happens next is outside what our data can describe — the order keeps walking into levels we did not record, or it rests, or it moves the price and invites a reaction.
That 28.7% also means the $25,000 cost figures in the previous section are understated. They are medians over the quotes where the fill succeeded, which is the easier 71% of moments. The hard ones are excluded because we cannot price them.
If your backtest fills a $25,000 order at the touch, it is describing a market with infinite depth at the best price. The real one ran out of book more than a quarter of the time.
6. Does it hold up across sixteen months?
Month
Median spread
2025-04
65bp
2025-05
62bp
2025-06
74bp
2025-07
73bp
2025-08
54bp
2025-09
66bp
2025-10
62bp
2025-11
51bp
2025-12
58bp
2026-01
62bp
2026-02
58bp
2026-03
68bp
2026-07
44bp
Twelve of the thirteen months sit between 51 and 74 basis points. The level moves around with conditions, but the order of magnitude is stable, and no month is remotely cheap.
The outlier is instructive rather than alarming. In July 2026 we changed what we were recording — from a fixed 15-symbol watchlist to a rotating 30-slot scanner ranked by change percent — and the population of symbols changed with it. On those sessions alone the $5 to $20 band costs 44bp in the opening half hour against 66bp for the pooled sample.
Which is its own finding. The same measurement came out a third cheaper, and the only thing that changed was which symbols were being watched. Before optimising a strategy, it is worth checking whether the universe is doing more to your results than the rules are.
7. What this actually means for a strategy
Put the cost next to your target before anything else. If the target is not several multiples of the round trip in the band you trade, the rest of the work does not matter. This single comparison invalidates more strategies than any other check we run.
Cheap stocks are not cheap. The $1 to $5 band costs between two and five times the $20 to $200 band depending on order size, and the gap widens as the order grows.
The opening is the expensive half hour. If an edge exists only between 09:30 and 10:00, it has to clear the highest cost bar of the day to be real.
Your size is part of your strategy. A rule that works at $1,000 and fails at $25,000 is not a rule with a capacity problem to solve later. It is a rule whose edge was smaller than the cost of trading it properly.
8. Limits
These are our recordings, not the market. Both recording setups watched an active, volatile subset of US equities — a fixed watchlist for most of the period and a change-ranked scanner at the end. This is not a description of the S&P 500. It is a description of the kind of names a day trading strategy actually trades, which is the population we care about, but it is a population.
One data feed. Ten levels as one broker delivered them. Another vendor's book would differ, and consolidated depth would differ more.
The walk is a simulation, not a fill. We priced a market order against a book that was sitting there a moment earlier. A real order removes that liquidity and invites reaction. Our number is therefore a floor on the cost, not an estimate of it.
Ten levels is where our vision ends. For 28.7% of $25,000 orders the honest answer is that we do not know what it would have cost.
Medians, not averages. Half the time it is worse than the number shown. The tail matters and we are not describing it here.
The US stock backtest walkthrough covers how to record the data this study is built on, and the factor reference explains the order book factors used to compute it. The crypto equivalent of this study is here.
Originally published by TraderWe on August 16, 2026. You may quote and link to this page. Republishing the full text without a link back to the original is not permitted.
Medians over regular hours are a fair starting point, but the tail is where accounts die, I'd want to see the upper decile of that fill cost, especially around the open. Do you have the distribution split by time of day, or just the pooled median?
Been trading since the days when you called a guy on the phone and he told you your fill an hour later, so none of this surprises me. What surprises me is how many young folks still write backtests off the last print. Stay humble.
Spread is split by hour and price band in section two. The walk cost is not. Those are medians pooled across the session, and medians were on purpose because a handful of blown-out quotes drags an average somewhere useless.
Your point stands anyway: a median says nothing about the decile that empties an account. The quotes are all still here, so an upper decile by hour is a query rather than a new recording exercise. It is not in the piece, and we are not going to put a number on it in a comment before we have run it.
The unfillable-inside-ten-levels number is the part worth pinning on the wall; depth is not a constant and sizing up against a thin ladder is a different trade than the one you tested.
There's something calming about seeing the cost written down instead of felt vaguely after a bad week. I think a lot of us carry a quiet suspicion that we're leaking somewhere, and that suspicion turns into overtrading to make it back. Naming the friction lets me stop blaming my discipline for something that was structural all along — I'll be sitting with that before my next session rather than changing any settings.