The quoted price is only good for about $1,200 to $5,200: order book depth measured
By TraderWe· Published Aug 16, 2026· Updated Aug 17, 2026· 💬 5
Study details
Measured
2025-04-02 – 2026-07-31, 264 recorded sessions; 35,207,932 quotes
Instruments
US equities, intraday movers; ten levels of book on both sides
Method
for each quote, fill a market buy against the recorded ask ladder and find the largest order whose average fill stays within a given distance of the best offer
Result
the quoted price supports $1,155 to $5,150 depending on price band. Ten levels hold $34,835 to $83,636 on the ask side, of which only 3.9% to 6.3% sits at the best price
A quoted price is not an offer to trade any amount. It is an offer to trade a specific quantity, and on the names a day trading strategy actually watches, that quantity is smaller than most people assume.
We walked the recorded order book across 264 US equity sessions to answer one question: at the price you are looking at, how much can you actually buy?
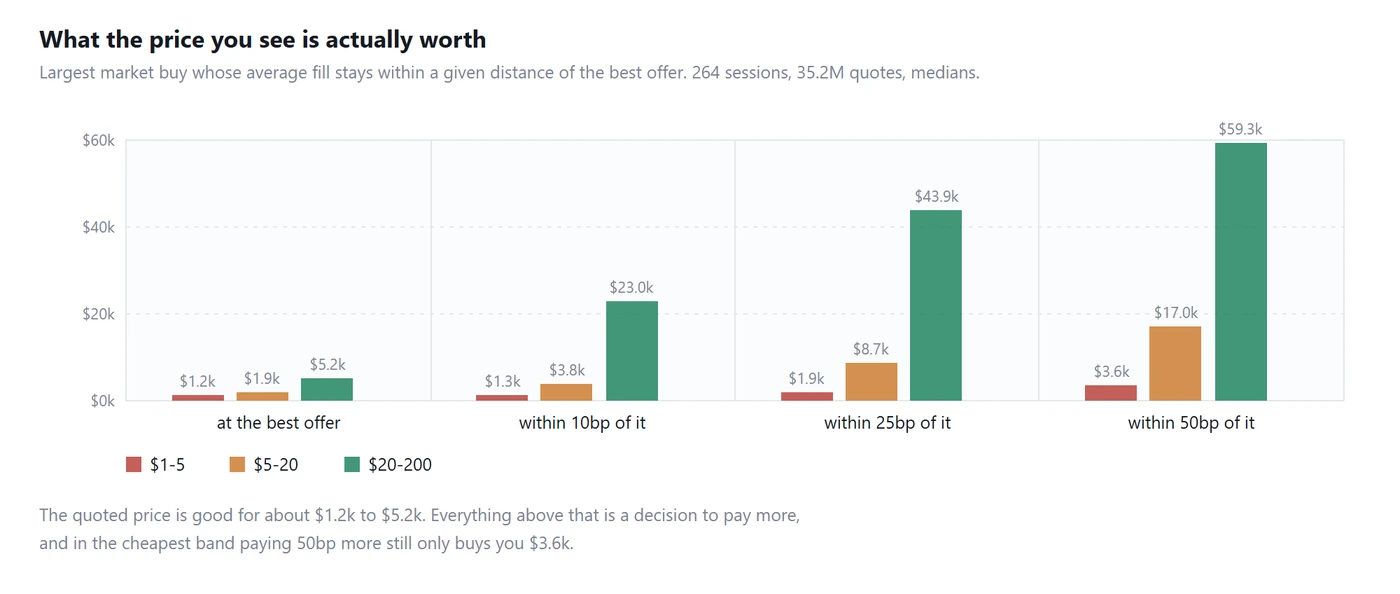
The short answer is between about $1,200 and $5,200, depending on the price of the stock. Everything above that is not a fill, it is a decision to pay more.
1. What we measured
For every quote in the archive we take the recorded ask ladder — ten price levels with the resting size at each — and fill a market buy against it, level by level, tracking the quantity-weighted average price.
Capacity at k basis points is the largest order whose average fill stays within k basis points of the best offer. At k = 0 that is simply the money resting at the best offer. At k = 25 it is how much you can buy while giving up no more than a quarter of a basis point per hundred against the quoted price.
We measure against the best offer rather than the mid deliberately. Measuring against the mid folds the spread into the answer, and since half a spread is already 20 to 35 basis points on these names, every small budget comes out as zero and the number tells you nothing. Against the touch, the measure isolates one thing: what depth costs you, separately from what the spread costs you. The spread is priced in our companion study.
Depth to ten levels is the sum of price times size across all ten recorded levels, on each side.
Regular trading hours only, on quotes where both sides are populated and the bid is not above the ask — a crossed quote usually means a halt rather than a market. All medians. The sample is 264 sessions from 2025-04-02 to 2026-07-31 and 35,207,932 quotes, the same archive as our cost measurement.
2. What the price you see is worth
Largest market buy staying within a given distance of the best offer, by price band
At the best offer
Within 10bp
Within 25bp
Within 50bp
$1-5
$1,155
$1,299
$1,871
$3,613
$5-20
$1,909
$3,757
$8,696
$17,010
$20-200
$5,150
$22,977
$43,882
$59,276
The first column is the honest size of the quoted price. A $2 stock shows you a price that is good for about $1,155. A $50 stock shows you one good for about $5,150.
The rows then behave completely differently as you allow yourself to pay more.
In the $20 to $200 band, accepting 10 basis points above the touch multiplies your size by four and a half, to $22,977. The book is deep and the extra levels are close together, so a small concession buys a lot of room.
In the $1 to $5 band, accepting the same 10 basis points buys you almost nothing — $1,299 against $1,155. Accepting a full 50 basis points still only gets you to $3,613. The levels are far apart in relative terms because the minimum tick is a cent, so there is no gentle slope to walk up. You are either at the touch or you have jumped a long way.
3. Ten levels is not very much money
Ask side, 10 levels
Bid side, 10 levels
Share at the top level
$1-5
$34,835
$28,724
3.9%
$5-20
$44,075
$39,475
4.7%
$20-200
$83,636
$79,219
6.3%
The entire visible ladder — twenty price levels across both sides — holds somewhere between $30,000 and $85,000 on a typical quote. That is the whole of what our recording can see, and it is not a large amount of money.
Two things follow.
The top level is a small fraction of the visible book. Between 3.9% and 6.3% of ten-level depth sits at the best price. The other 94% or so is behind it, at worse prices.
The two sides are similar, with the bid slightly thinner. Bid depth runs 82% to 95% of ask depth across the three bands, lowest in the cheapest one. An exit therefore costs roughly what an entry costs, and a little more in low-priced names. Strategies are usually sized on the entry and the exit is assumed to be free; it is not, and it is about the same.
4. The opening half hour is the thinnest
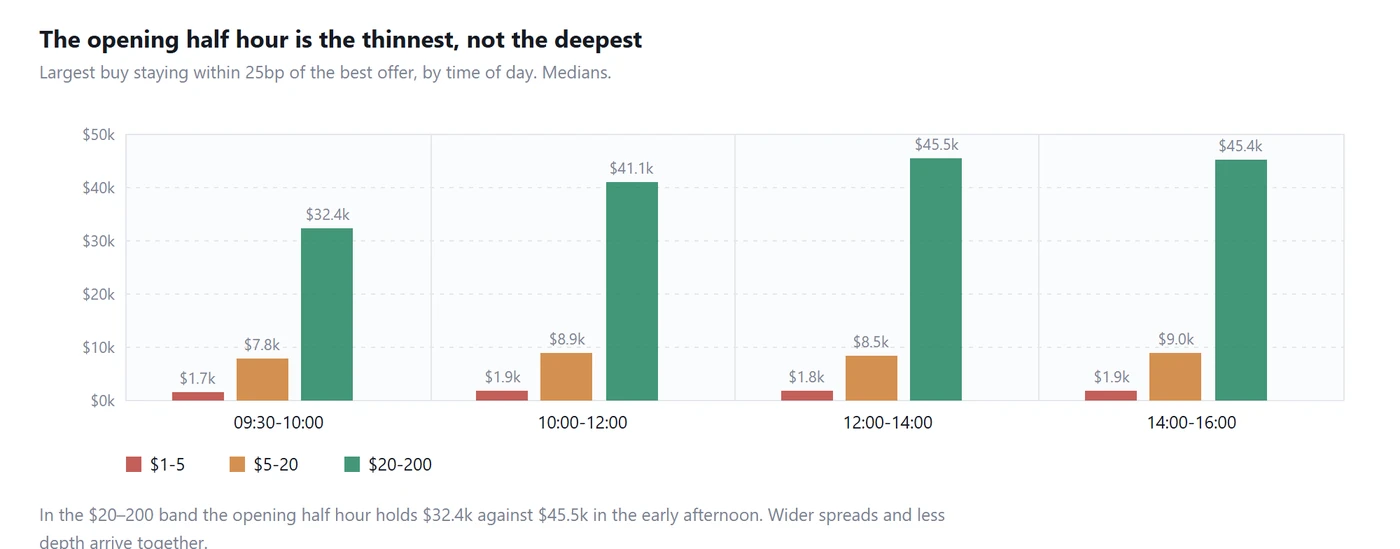
Largest buy staying within 25bp of the best offer, by time of day
Time of day
$1-5
$5-20
$20-200
09:30-10:00
$1,659
$7,831
$32,449
10:00-12:00
$1,937
$8,862
$41,135
12:00-14:00
$1,832
$8,515
$45,456
14:00-16:00
$1,898
$8,967
$45,354
In the $20 to $200 band the opening half hour supports $32,449 against $45,456 in the early afternoon — about 29% less. The cheaper bands are flatter but never better at the open than later.
Put that next to the cost measurement, where the same opening half hour has the widest spreads of the day, and the picture is consistent rather than surprising: at the open you pay more per share and you can trade less of it before you pay even more. The period with the most price movement is the period in which it is hardest to act on.
This matters because the opening half hour is where most day trading strategies are written to operate. It is not the easy part of the day. It is the part where execution is least forgiving, and a backtest that fills at the touch will never tell you so.
5. What this means for sizing
Your position size has to fit the band you trade. A $10,000 position is unremarkable in a $50 stock and is roughly three times the entire 50-basis-point capacity of a $2 stock. The same strategy at the same size is a different strategy in each.
Cheap stocks do not scale. This is the sharpest finding here. From the touch to 50 basis points, the $20 to $200 band gains a factor of twelve in size; the $1 to $5 band gains a factor of three, from a much smaller base. If a rule only works on low-priced names, its capacity is fixed at a few thousand dollars per entry regardless of how much you are willing to pay.
Size the exit too. Bid depth is close to ask depth, so whatever the entry costs in impact, budget the same again on the way out.
Test your size, not just your rules. Running the same rules at $1,000 and at $25,000 in a backtest that walks the recorded book is a five-minute check, and it separates ideas with a small edge from ideas with an edge that only exists at sizes you will not trade.
6. Limits
Ten levels is where our vision ends. Everything here describes the visible ladder. A real order that exhausts it keeps going into levels we did not record. Our capacity numbers are therefore a floor for the cost and a ceiling for the certainty.
A recorded book is not a fill. We are pricing an order against liquidity that was sitting there a moment before. A real order removes that liquidity and invites reaction from everyone watching. Nothing here models that.
These are our symbols. The archive covers the kind of active, volatile names a day trading scanner selects, not the whole market. Depth in a mega-cap is orders of magnitude larger and this study says nothing about it.
Medians. Half the time there is less available than the number shown. Sizing to the median is sizing to a coin flip.
One broker's book. Another vendor's depth, and consolidated depth across venues, would differ.
If you want to run this on your own recordings, the ladder factors are documented in the factor reference, and the US stock backtest walkthrough covers the recording side.
Originally published by TraderWe on August 16, 2026. You may quote and link to this page. Republishing the full text without a link back to the original is not permitted.
- book depth is the part of my checklist i never wrote down
- adding: check top-of-book size before sizing in
- will log fills vs quote for a week and see
Ooh this one made me sit up with my coffee - I always treated the quote as "the price" and never thought about how thin that top level actually is. Anyone else splitting entries into smaller pieces after reading this?
been doing this on crypto for a while lol, the top of book on the smaller pairs at 3am is basically decoration. nice to see the same idea measured on equities.
Honest question - if only a small slice of the total depth sits at the best price, does that mean the deeper levels are mostly there for show, or do they actually get hit often? Also not sure I follow how they handled quotes that changed mid-fill, feels like the ladder is stale the moment you send anything.
The useful framing here is that anything past the top level isn't slippage happening to you, it's a cost you chose when you sized the order. My one gripe: this is a snapshot walk of a recorded ladder, so it ignores hidden liquidity and refresh, which cuts both ways - you can get filled better than the book suggests, or watch it vanish ahead of you. Still, if your average size is comfortably above what the best offer holds, you're paying an execution tax every single entry and probably blaming the strategy for it.