Every strategy is a sentence made of factors. Price, Strength, AskSize1, Sma(60) are the nouns; the conditions and the Buy() are grammar.
This is the full list, what each name actually contains, and the rules that decide how they behave. It is long on purpose: most of the time people lose in a backtest goes to a factor that did not mean what they assumed.
Two things before the list. Every name here works identically in a backtest and live. There is no separate "live indicator library", and the strategy text you test is the text that runs. And every number in the figures comes from a real recording: CYCU on 2026-07-31, straight out of a recorded tick database.
1. What a factor is
Your strategy is evaluated once per incoming update — per tick, not per bar. Each time, the engine hands you one row: the state of that symbol at that instant. A factor is one column of that row.
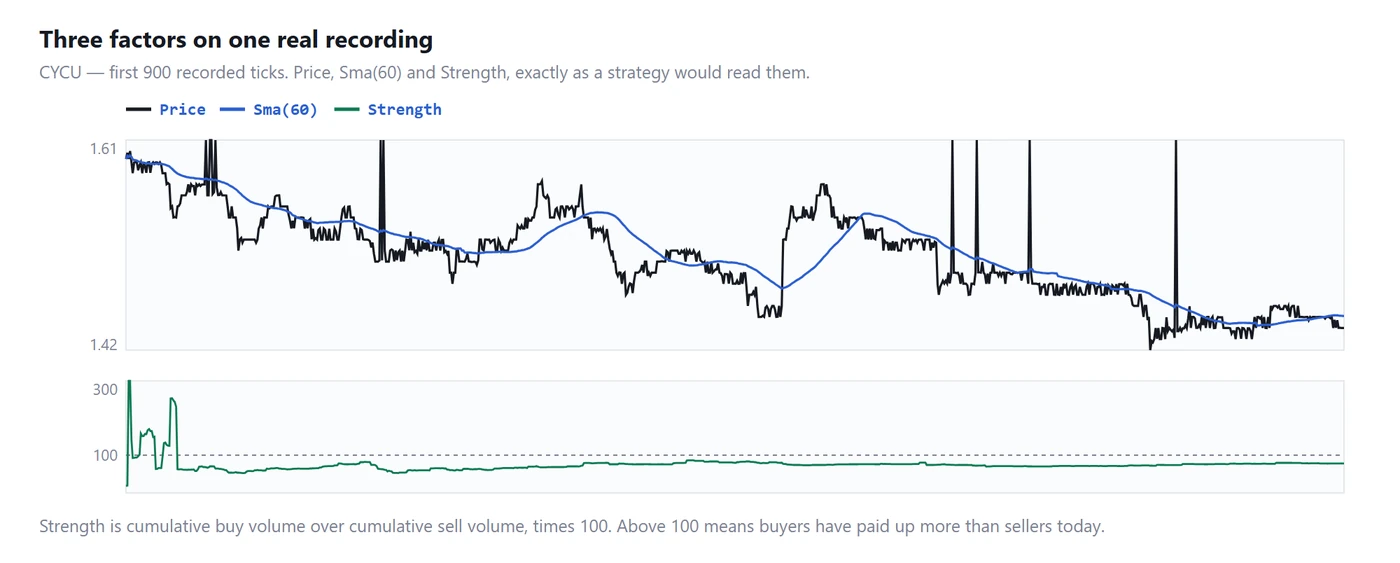
Price, Sma(60) and Strength drawn from 900 real recorded ticks of CYCU
Three factors, one recording, 900 consecutive ticks. Price is the raw print, Sma(60) the 60-tick average of that column, Strength the order flow underneath on its own scale. Your strategy sees these values in this order, one row at a time. It cannot see the right-hand side of the chart, because that has not happened yet.
That sentence is the entire discipline. Everything below is a catalogue of what is on the left-hand side.
2. Price and the session
Factor
What it holds
Price
Last traded price at this instant
OpenPrice
Today's open
HighPrice
Today's high, so far
LowPrice
Today's low, so far
ChangePct
Percent change against the previous close
HlMidPct
Percent change measured against the midpoint of today's high and low
HlRangePct
Today's range, low to high, as a percentage
HighPrice is the high so far today, not the high of the day. At 09:31 it is a five-minute high; at 15:59 it is a session high. So Price >= HighPrice fires constantly in the first minutes and almost never in the last hour. The same line means something different at different times of day. For a fixed lookback instead, use HighestPrice(n), which behaves the same way all day.
ChangePct is measured from the previous close, so it carries the overnight gap: a stock that gapped up 8 percent and has done nothing since still reads about 8. If you meant "moved since the open", that is (Price - OpenPrice) / OpenPrice * 100. Both are legitimate — they are simply not the same thing, and the gap is doing most of the work in the average screener condition.
HlRangePct tells you how much room today has had — a name with a 2 percent range and one with a 40 percent range should not share a stop distance. HlMidPct tells you where in that range you are, a cleaner "extended or not" measure than distance from a moving average because it is scaled to the symbol's own day.
3. Turnover, and why absolute thresholds fail
Factor
What it holds
DayAmount
Cumulative traded value today (price × quantity)
TradeAmount
Traded value in this one second
BuyAmt / SellAmt
This second's value, split by side
DayBuyAmt / DaySellAmt
Today's cumulative value, split by side
MaxBuyAmt / MaxSellAmt
Largest single buy / sell value today
MaxBuyPrice / MaxSellPrice
The price at which that largest trade happened
DayAmount is the liquidity floor most strategies should start with — the one filter that reliably separates "this fill will be roughly what I expected" from "this fill will be a story". It is cumulative, so its meaning drifts through the day: a $2M threshold is a serious hurdle at 09:35 and none at all at 15:00.
TradeAmount is per-second, which makes it the surge detector. A raw threshold on it is a mistake that looks reasonable:
# The common mistake — an absolute threshold
if TradeAmount > 100000:
    Buy()
$100,000 per second is a firehose for a $2 stock and a rounding error for a mega-cap. Compare a symbol against its own recent behaviour instead — that is what the window functions are for:
# Compare the symbol against its own recent average
avg = AvgTradeAmount(300)
if avg > 0 and TradeAmount > avg * 5:
    Buy()
Now the condition means "five times its own normal" — the same statement in every name you point it at. Almost every absolute threshold in a strategy should be rewritten this way.
MaxBuyPrice and MaxSellPrice are the most overlooked factors here. They give the price level where the largest single order of the day went through — often a level the market returns to and reacts at. Cheap to test, rarely used.
4. Order flow: buys, sells, and Strength
Factor
What it holds
BuyVol / SellVol
Quantity in this second, split by aggressor side
Strength
Buy quantity ÷ sell quantity × 100
"Aggressor side" is the important qualifier. Every trade has a buyer and a seller; what is classified here is who crossed the spread to make it happen. BuyVol lifted the offer, SellVol hit the bid. This is impatience, measured — and impatience is what moves price over the next few seconds.
Strength compresses that into one number: above 100, buyers have paid up more than sellers.
The window differs by asset class, and you should know which one you are reading:Stocks — cumulative since the session open. At 15:00 it is a six-and-a-half-hour average and one aggressive minute barely moves it; at 09:35 it is fast and noisy. Same factor, different responsiveness, purely as a function of the clock.
Crypto — a rolling 30-minute window. There is no session open to count from, and "cumulative since the app started" would measure your own uptime rather than the market — resetting on every restart and reading differently on two machines watching the same coin. A 30-minute window reads the same whenever you start.
Both are capped at 500, and both return 500 when there is buy volume and no sell volume at all. Otherwise the ratio runs to infinity on the first thin print of the day. Keep that cap in mind before writing Strength > 400: near the ceiling the number stops being a scale and becomes a flag.
For consistent behaviour through the day, prefer AvgStrength(n) — the same measurement at 09:35 and at 15:35.
5. The order book: ten levels, live
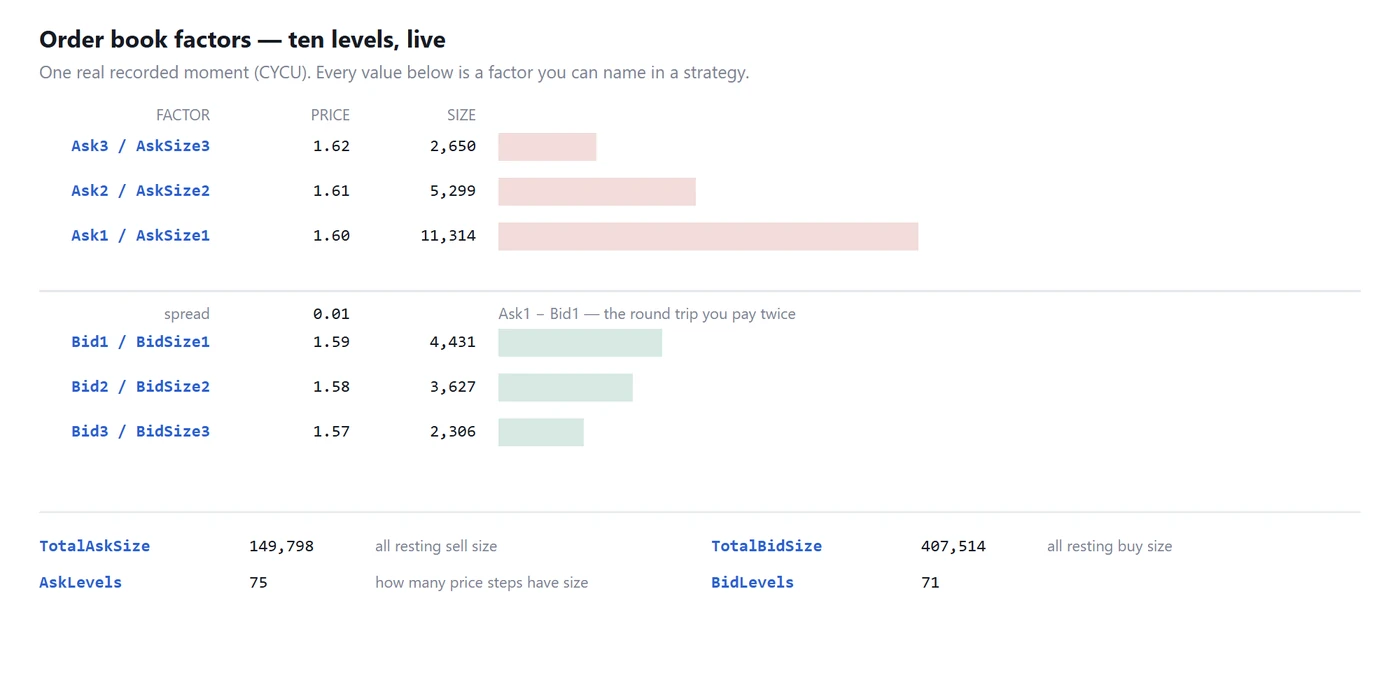
Order book factors on one real recorded moment — Ask3 to Bid3 with resting size, spread, and the totals
Factor
What it holds
Ask1 … Ask10
The ten best offer prices
Bid1 … Bid10
The ten best bid prices
AskSize1 … AskSize10
Resting quantity at each of those offers
BidSize1 … BidSize10
Resting quantity at each of those bids
TotalAskSize / TotalBidSize
All resting quantity, each side
AskLevels / BidLevels
How many price steps currently hold size
The spread is a cost you can measure in advance.Ask1 - Bid1 is the round trip before commission, and it is not a constant. It widens exactly during the surge you were planning to buy. A strategy targeting a 0.3 percent move on a symbol whose spread is 0.4 percent does not have a small edge; it has a negative one. One line prevents it:
spread_pct = (Ask1 - Bid1) / Price * 100
if spread_pct < 0.15 and ChangePct > 3:
    Buy()
Imbalance should be a ratio, never a raw number.BidSize1 > 10000 means something different for every symbol and price level; BidSize1 / AskSize1 > 2.5 means the same thing everywhere:
if AskSize1 > 0 and BidSize1 / AskSize1 > 2.5 and BuyVol > SellVol:
    Buy()
Note the zero-denominator guard, and note that the imbalance is confirmed by actual trades. Resting size is an intention, and intentions get cancelled. BuyVol > SellVol is the part that already happened.
AskLevels and BidLevels are a book-quality check that nothing else replaces. They count how many price steps actually hold size — across the whole depth the venue delivers, not just the ten levels in the ladder. A book with 75 populated levels is deep and continuous; a book with 4 has holes in it, and a market order walks straight through them. In the recorded moment above, CYCU shows 75 ask levels and 71 bid levels — healthy. When those numbers collapse, your fill assumptions collapse with them, and no amount of backtest tuning will tell you so. TotalAskSize and TotalBidSize summarise that same full depth.
One honest limitation: the priced ladder stops at ten levels each side. That is far more than the single best bid and offer most retail tools expose, and it is enough to see where pressure sits. But it is not full depth of book, and it does not identify individual orders or participants. Anything that requires knowing who is resting there is outside what this data supports.
6. Two clocks: per-second and _1m
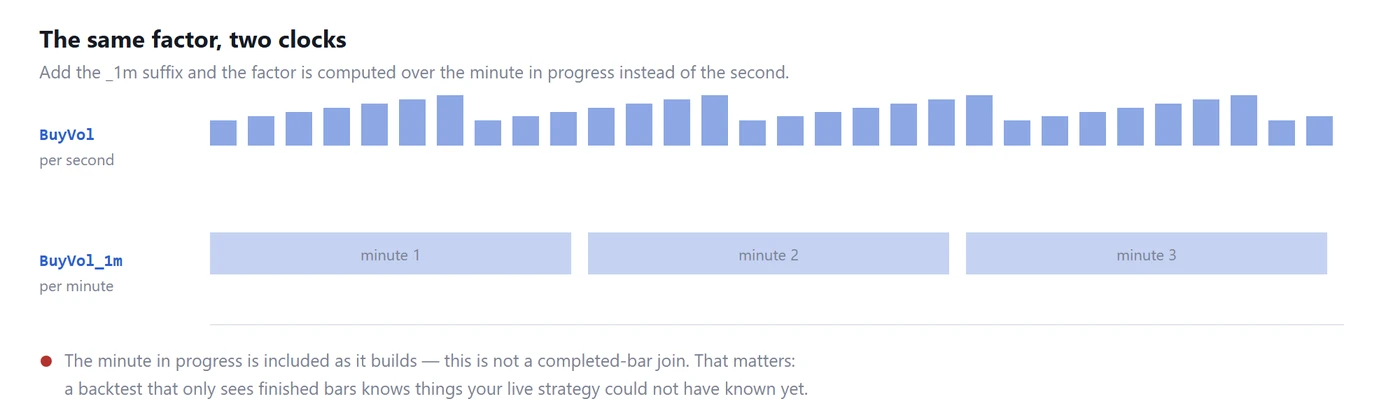
The same factor computed per second and per minute, with the in-progress minute included as it builds
Add the _1m suffix and the factor is computed over minutes instead of ticks.
Factor
What it holds
BuyVol_1m / SellVol_1m
Quantity this minute, by side
TradeAmount_1m
Traded value this minute
BuyAmt_1m / SellAmt_1m
Value this minute, by side
CandleOpen / CandleHigh / CandleLow
The current minute's bar, so far
Sma_1m(n)
Moving average over nminutes
The suffix works on window functions too, and there the argument changes unit: Sma(20) is twenty ticks, Sma_1m(20) twenty minutes.
The detail that matters most: the minute in progress is included as it builds. At 09:34:20, CandleHigh is the high of the twenty seconds elapsed so far in that minute — not of the completed 09:33 bar.
This is deliberate, and it is the opposite of how most backtest tools join minute data. If a backtest only ever shows completed bars, then at 09:34:20 it is showing a bar whose closing price your live strategy could not possibly know yet. That is a look-ahead, and it is the most common reason a backtest cannot be reproduced live.
Use the tick clock when the next few seconds decide the outcome. Use _1m to stop reacting to individual prints and read the shape of the move instead. Mixing them is normal and often correct: a minute-scale trend filter, a tick-scale trigger.
7. Window functions
Function
Returns
Sma(n)
Average Price over n ticks
HighestPrice(n) / LowestPrice(n)
Highest / lowest Price over n ticks
AvgStrength(n) / MaxStrength(n) / MinStrength(n)
Strength statistics over n ticks
MaxBuyVol(n) / MaxSellVol(n)
Largest single second of buy / sell quantity
SumBuyVol(n) / SumSellVol(n)
Total buy / sell quantity over the window
AvgTradeAmount(n)
Average per-second traded value
ChangeAngle(n)
Slope of ChangePct over n ticks, in degrees
AmountAngle(n)
Slope of DayAmount — how fast turnover is accelerating
Volatility(n)
Standard deviation of Price over the window, divided by its mean, × 100
RisingStreak(n) / FallingStreak(n)
Consecutive rising / falling ticks
Two of these deserve a note. ChangeAngle(60) fits the last 60 ticks of ChangePct and reports the slope as an angle, so "trending up" becomes a number you can threshold instead of a shape you eyeball. The slope-to-degrees conversion uses a coefficient from your engine settings, so the values are not comparable to another platform's "angle" — but they are comparable across symbols and days inside this one, which is all a threshold needs. AmountAngle does the same for turnover rather than price, and turnover often accelerates first.
Volatility(n) is not a raw standard deviation but a standard deviation divided by the mean — a percentage, and that division is what makes it comparable. A $2 stock and a $400 stock cannot be compared on absolute movement, but both can be read as "moved 1.4 percent of its own price over the last 300 ticks". It is the right input for sizing a stop.
Every window function takes an optional second argument: how many ticks ago to end the window.Sma(20) # 20-tick average, as of now
Sma(20, 5) # 20-tick average, as it stood 5 ticks ago
That is what lets you express a crossing rather than a level, and the difference is not cosmetic. "Price is above the average" is true for long stretches and fires on every tick of them. "Price crossed above just now" is true once:
# Above now, below five ticks ago — it crossed just then
if Price > Sma(60) and PriceN(5) <= Sma(60, 5):
    Buy()
Most people write the first form and mean the second. It is probably the most common reason a strategy produces ten times the trade count its author expected.
8. Reading the past: the N family
Any factor name with N appended returns its value that many ticks ago.
PriceN(10)          # Price, 10 ticks ago
ChangePctN(30)      # ChangePct, 30 ticks ago
BuyVolN(5)          # BuyVol, 5 ticks ago
AskSize1N(3)        # AskSize1, 3 ticks ago
TotalAskSizeN(20)   # TotalAskSize, 20 ticks ago
This works generically: if the name is a real column, appending N gives you its history — all ten book levels, the totals, the minute factors. It is how you express change over time for anything, not just price:
# Is the offer being cleared away? A wall coming off opens the path up
if AskSize1N(10) > 0 and AskSize1 < AskSize1N(10) * 0.4 and BuyVol > SellVol:
    Buy()
9. Position context
These exist only while you hold a position, so they belong in sell conditions.
Factor
What it holds
ProfitPct
Current profit, percent
ProfitAmount
Current profit, currency
MaxProfitPct / MinProfitPct
Best / worst this position has been
HoldTime
Seconds since entry
EntryPrice
Your fill price
PositionQty
Quantity held
BuySplitCount / SellSplitCount
How many scale-ins / scale-outs have executed (split orders only — otherwise 0)
MaxProfitPct turns a fixed target into a trailing exit. ProfitPct alone can only say "take 2 percent". MaxProfitPct can say "take 2 percent, but if it reached 5 and gave back a third, leave":
if ProfitPct >= 2:
    Sell()
elif MaxProfitPct >= 5 and ProfitPct <= MaxProfitPct * 0.65:
    Sell()
elif HoldTime > 900:
    Sell()
That last line is not optional. HoldTime is the exit that fires when nothing else does — the move never developed, the symbol went quiet, a condition you wrote can no longer become true. A strategy without an unconditional time exit carries a tail risk no backtest will show you, because in a backtest the position always eventually resolves. Live, it just sits there.
10. Session and universe
Factor
What it holds
HhmmSs
Time as a number — 93000 is 09:30:00
TradeTime
Full timestamp, YYYYMMDDHHMMSS
DataLength
How many ticks have accumulated for this symbol
InUniverse
Whether this symbol is currently in your ranked candidate list
HhmmSs is a plain integer, so time windows read naturally:
if 93000 <= HhmmSs <= 100000 and ChangePct > 5:
    Buy()
DataLength protects your windows. Sma(300) on a symbol that started streaming 40 ticks ago is not a 300-tick average. It is a 40-tick average wearing a 300-tick name. Requiring DataLength > 300 first costs one line and removes a whole class of phantom signals near the open.
InUniverse tells you whether the symbol is in the ranked list your strategy actually watches. This matters more than it sounds: a backtest that evaluates every symbol in the database is testing a strategy you cannot run, because live you subscribe to a limited number of names chosen by a ranking that shifts through the day. Gating on InUniverse keeps the backtest inside the same constraint the live engine has.
11. Korean names work too
Every factor has a Korean alias and the editor accepts either: 현재가 is Price, 이동평균(20) is Sma(20), 매도잔량1 is AskSize1, 수익률 is ProfitPct.
The alias is resolved at parse time, so there is no behavioural difference and no cost. Mixing them is legal, though your future self will thank you for picking one. Autocomplete searches both, so typing 체결 finds Strength.
12. What is deliberately not here
No RSI, MACD, Bollinger Bands or stochastics as strategy factors. Not an oversight. These are bar constructions with parameters chosen for a world of daily closes. Dropping them onto tick data does not make them tick indicators; it makes them daily indicators fed the wrong input at the wrong rate. The parts are here if you want the idea behind them: Sma for the mean, Volatility for the band width, RisingStreak and Strength for the momentum.
No VWAP. Genuinely missing rather than excluded on principle. Better said plainly than discovered mid-strategy.
No cross-symbol factors. A strategy evaluates one symbol at a time and cannot read another's Price. Index-relative and pairs logic sit above the strategy layer.
No news, sentiment or fundamentals. Everything here comes off the market data feed.
13. Putting it together
One entry using each category once, written the way this page argues for:
# Liquidity floor — below this, the fill becomes a story
liquid = DayAmount > 5000000 and DataLength > 300

# Cost — a spread wider than the target loses before it starts
spread_pct = (Ask1 - Bid1) / Price * 100

# Surge — measured against the symbol's own recent average, not an absolute
avg_amt = AvgTradeAmount(300)
surging = avg_amt > 0 and TradeAmount > avg_amt * 4

# Flow — resting size is intent, trades are fact. Require both
book_ok = AskSize1 > 0 and BidSize1 / AskSize1 > 1.5
flow_ok = BuyVol > SellVol and AvgStrength(60) > 110

# Trend — an angle gives it a threshold
trending = ChangeAngle(60) > 15 and Price > Sma(60)

if liquid and spread_pct < 0.15 and surging and book_ok and flow_ok and trending:
    if 93500 <= HhmmSs <= 153000:
        Buy()
And the exit it needs:
if ProfitPct >= 2:
    Sell()
elif ProfitPct <= -1:
    Sell()
elif MaxProfitPct >= 4 and ProfitPct <= MaxProfitPct * 0.6:
    Sell()
elif HoldTime > 900:
    Sell()
elif HhmmSs >= 155500:
    Sell()
The numbers in both blocks are starting points, not tuned values. They are round, plausible, and deliberately un-optimised: a tuned parameter published in a reference article is worse than no parameter at all, because it looks authoritative and was fitted to a period you did not trade. Treat every constant as a slot to fill, and change one at a time.
14. Five mistakes this list makes easy to avoid
Mistake
What to write instead
Absolute thresholds — TradeAmount > 100000 means something different for every symbol
TradeAmount > AvgTradeAmount(300) * 5
"Above" when you meant "crossed" — Price > Sma(60) is true for long stretches
Price > Sma(60) and PriceN(5) <= Sma(60, 5)
No spread guard — the spread is widest exactly when the signal looks best
(Ask1 - Bid1) / Price * 100 < 0.15
Windows longer than the data — Sma(300) with 40 ticks of history is a 40-tick average
DataLength > 300
No unconditional time exit — every other exit needs a condition to become true
elif HoldTime > 900: Sell()
The templates in the Strategy Library are built from the names on this page — each a small, complete example you can open and read. If something here is wrong or missing, say so in the community: this reference is meant to stay accurate, and corrections get folded back in.
Originally published by TraderWe on August 3, 2026. You may quote and link to this page. Republishing the full text without a link back to the original is not permitted.
Morning all! Read this over my first cup and honestly the 'factor is one column of the row' line cleared something up I'd been fuzzy on for months. My question is the tick-not-bar part - if my condition fires on an update, does it just keep firing on every following update while the condition stays true, or is that on me to gate? Anyone got a clean way they handle that?
So the big reveal is that most losses in a backtest come from people not knowing what their own indicators contain. Shocking. Meanwhile my chart with nothing but price on it never once surprised me about what it meant.
The bit that matters isn't the list, it's the reminder that your strategy can't see the right side of the chart. Watched plenty of clever folks over the years build systems that quietly assumed otherwise. Stay humble.
No, it does not keep firing. Once the entry fills you are holding, and while you hold, the entry conditions are not evaluated at all, so a condition that stays true does not buy again.
The exception is split entries. If you have those on, that is precisely the case where you want it to fire again, and it is bounded by the split count you set. While a position is open it is the exit side being evaluated on every update.