Our crypto walkthrough starts with a download. This one cannot, and that is worth saying in the first paragraph rather than burying it: we publish sample crypto files because crypto venues permit it, and we do not publish US equity samples because equity market data is licensed and redistributing it is not ours to do.
So a US stock backtest starts a day earlier than a crypto one. You record a session, then you test on it. That turns out to be the honest order anyway. The decisions you make while recording are the ones that decide whether the backtest means anything, and a downloaded file hides them from you.
This guide walks the whole path: choosing what to watch, recording a session, checking what you actually got, running a strategy on it, and reading the number correctly. The last part is the one that matters most and the one most guides skip.
1. What you need
TraderWe installed and signed in, and one broker connected for market data. Which broker changes what your recording contains, so this choice comes first.
Broker
US stock data
What to know
moomoo
Level 2, free
Ten book levels at no cost. Order book is capped at 50 concurrent symbols, so it sets your universe size. See the moomoo setup guide
Interactive Brokers
Subscription required
Solid feed once subscribed. On a delayed-data account some tick types never arrive and change percent reads zero all day. See the IBKR setup guide
Alpaca
Free tier is IEX only
The free feed carries IEX prints only and has essentially no pre-market trades. Pre-market work needs the paid SIP feed. See the Alpaca setup guide
You do not need a funded account to record. Market data and recording work on a connection alone.
2. Deciding what to watch
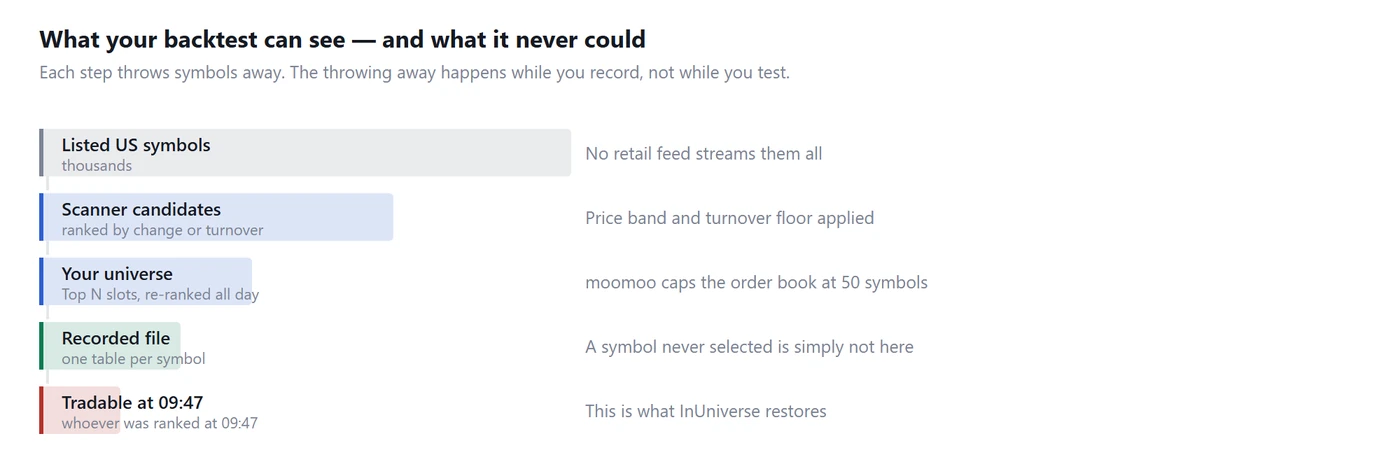
Here is the problem crypto does not have. A crypto venue lists a few hundred pairs and you can stream most of them. The US equity market lists thousands, and no retail data connection will stream them all — moomoo caps the order book at 50 symbols at once, and every other vendor has a limit of its own.
So you do not record the market. You record a shortlist, and the shortlist is chosen by a scanner that re-ranks through the day. In Settings, the scanner takes:
Setting
What it does
Ranking
Sort candidates by change percent or by turnover
Top N
How many symbols to hold in the universe at once
Price band
Minimum and maximum price — the low end is where spreads eat everything
Turnover floor
Minimum traded value today, applied as a hard filter
Change floor
Minimum change percent, applied after ranking, with the remaining slots backfilled by turnover
That last row is worth a sentence. The floor is applied after ranking, not before. Ranking the top 30 by turnover and then requiring 3 percent change leaves about six names, because the two lists barely overlap. Ranking 200 deep and then filtering leaves enough to fill 33 slots — and the share of mega-caps in the result drops from roughly 28 percent to 2 percent, because mega-caps rank high on turnover and almost never move 3 percent.
Whatever you choose here is a hard constraint on every backtest you will ever run on that recording. A symbol that was never in the universe is not in the file, and no strategy can find it later. This is the single most consequential screen in the product and it looks like the least important one.
3. Recording a session
Start the recorder before the session you want. The US day, in the order it happens:
Time (ET)
What is happening
04:00
Pre-market opens. Thin, wide, and only on feeds that carry it
09:30
The open. Highest volume, widest spreads, most of the day's movement
10:00
The opening burst is over and conditions change materially
16:00
The close
Recording writes two files per day:
record/stock/1s/stock_1s_20260731.db      per second
record/stock/1m/stock_1m_20260731.db      per minute
The date is the Eastern trading day, not your local date. That matters if you are not in the US: a session recorded from Seoul still lands in one file named for the ET day, so the file boundary and the daily cumulative counters agree.
Each file holds one table per symbol, with price, per-interval buy and sell volume, turnover, trade strength and ten levels of the order book on both sides. It also holds a universe table — the scanner's ranking through the day, timestamped. Remember that table; section 7 is about it.
A full session on a few dozen symbols is a few hundred megabytes at one second, considerably less at one minute.
4. Pre-market and after hours
US stocks trade before and after the regular session, and that is where a lot of the day's largest moves begin. It is also where the data gets least trustworthy, so it deserves its own decision rather than being something you discover afterwards.
Three things differ from regular hours.
Not every feed carries it. Alpaca's free tier is IEX-only and has essentially no pre-market prints. A strategy that looks quiet before 09:30 on that feed is not describing a quiet market, it is describing a feed with nothing in it. Check what your broker actually delivers before drawing any conclusion from a pre-market backtest.
Ranking behaves differently. Some venues reset their movers list at the open, so before 09:30 they hand you yesterday's ranking. A universe built from that is a universe of yesterday's news.
Costs are far higher. The spread table below covers regular hours only, deliberately. Pre-market spreads on the same names are wider by a large multiple, and the book is thin enough that a market order can walk several levels on a modest size.
None of that makes pre-market strategies impossible. It makes them a separate problem with its own data requirements, and one that should be attempted after you have something working in regular hours. A useful guard while you are learning:
if 93000 <= HhmmSs <= 160000 and InUniverse:
    Buy()
5. Checking what you actually got
Open Backtest. Your date appears in the available-data list with the symbol count, the file size and whether the engine has been prepared. Before writing a single strategy, look at those numbers.
Symbol count far below your Top N. The scanner never filled its slots. Usually the change floor is too high for that day, or the price band is too narrow. A universe that filled 8 of 33 slots is not a bug in the backtest, it is a setting.
A symbol that never moves. Some feeds go quiet on individual symbols while continuing to send data for others, and a frozen symbol looks calm rather than broken. A moving average over a frozen window is smooth; a volatility filter reading that window concludes conditions are calm. Both are artifacts. If a strategy looks unusually good on one name, check that name's price history first and your strategy second.
A file recorded on a holiday. It exists, it opens, and it is nearly empty. The US market closes on days that are not weekends.
6. Preparing the engine and running
Per-second files get prepared once. Preparation converts the SQLite file into the engine's binary format so runs read it directly, and the Backtest list shows a prepared flag per file. Skipping it does not break anything; it just re-converts on every run, which you will notice by the second run.
Now the strategy. It has two independent parts, and beginners routinely write only the first.
The entry:
# BUY — a trend condition, restricted to the part of the session it was meant for
if 100000 <= HhmmSs <= 153000 and Price > Sma(60) and DayAmount > 5000000:
    Buy()
HhmmSs is the clock as a plain integer, so 100000 is 10:00:00. Sma(60) is a 60-tick moving average. DayAmount is today's cumulative traded value, and the floor keeps the strategy out of names where the fill will cost more than the idea is worth. Every name here is in the factor reference.
The exit, which decides your results far more than the entry does:
# SELL — four independent ways out, checked in order
if ProfitPct >= 2.0:
    Sell()
elif ProfitPct <= -1.0:
    Sell()
elif HoldTime > 900:
    Sell()
elif HhmmSs >= 155500:
    Sell()
A target, a stop, a time cap, and a session close-out. The last two are the ones people leave out and the two that stocks punish hardest. HoldTime is in seconds. The close-out at 15:55 exists because a day trading strategy that holds through 16:00 is no longer a day trading strategy. It is an overnight position taken by accident, exposed to a gap it never agreed to.
Press run.
7. The universe is part of your strategy
This section is the reason we wrote the guide.
From the whole US market down to what a strategy could actually trade at a given moment
Your recording contains every symbol the scanner selected at any point during the day. But at 09:47 the scanner had a specific ranked list, and that list was different at 09:31 and different again at 14:00. Live, your strategy could only see the symbols on the list at that moment.
A backtest that lets a strategy trade any symbol present anywhere in the file is therefore testing a strategy you could not have run. It is not a small effect. The symbols that enter the ranking late are exactly the ones that already moved, so a backtest with unrestricted access spends its day buying things after they went up — and reports the result as skill.
The universe table records the ranking with its timestamps, and the factor InUniverse tells a strategy whether the symbol is currently on the list:
if InUniverse and Price > Sma(60):
    Buy()
One condition. It is the difference between a result you can act on and a result that will not survive contact with a live session.
8. Reading the number honestly
You now have a number. Here is what it is and is not.
One day is one sample. The same rules on the next day produce a different number, often a very different one. A single session tells you the rules execute. It tells you nothing about whether they work. The minimum honest test is many days across different conditions, compared against a deliberately uninformative baseline rather than against zero.
The open is not the easy part. Most day trading strategies are written for the first thirty minutes because that is where the movement is. That is also where the spread is widest, the book is thinnest relative to volume, and the difference between a simulated fill and a real one is largest. If your edge exists only between 09:30 and 10:00, treat it as unproven until you have measured what the execution costs there.
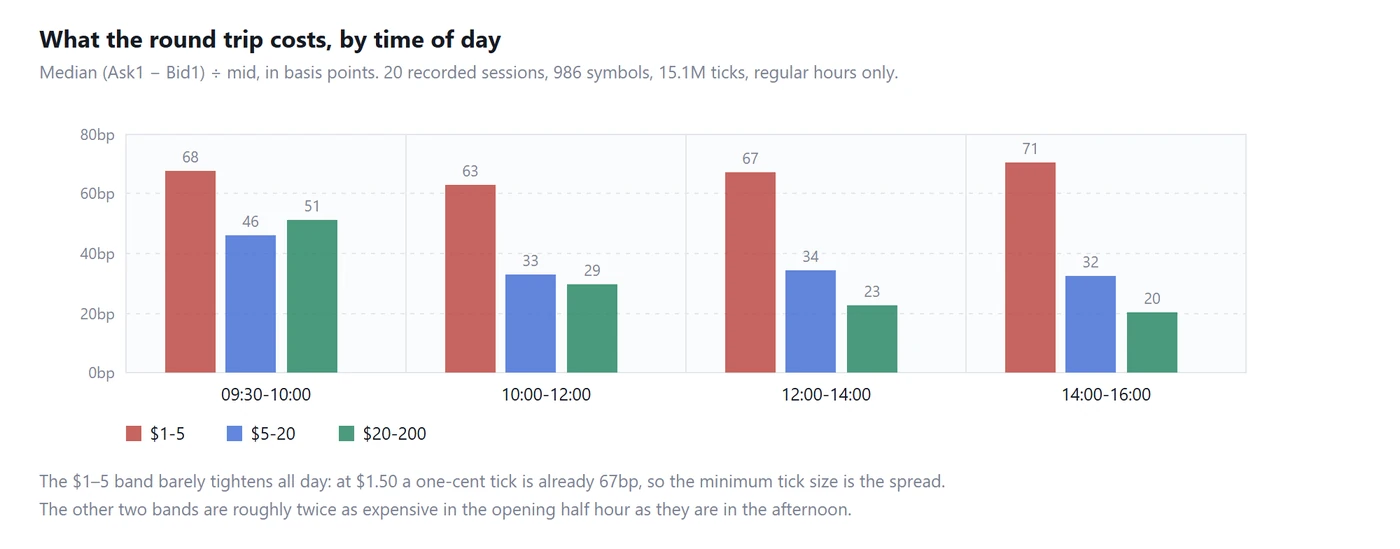
Here is that cost, measured on our own recordings. The definition is exact so you can reproduce it: (Ask1 - Bid1) divided by the mid, in basis points, taken as the median across every recorded tick in regular trading hours.
Median spread by time of day and price band, measured on 20 recorded sessions
The opening half hour is the most expensive time to trade in both of the bands where a strategy has room to work. A $20–200 name costs 51bp to round-trip between 09:30 and 10:00 and 20bp after 14:00 — two and a half times cheaper later in the day for the same instrument. In the $5–20 band it is 46bp against 32bp.
The $1–5 band never improves, and the reason is structural rather than behavioural: the minimum tick is one cent, and one cent on a $1.50 stock is already 71bp. There is no tighter quote available. A strategy targeting a 0.5 percent move on a $2 stock is giving most of it back on entry and exit no matter how good the entry is.
Put that number next to your target before you tune anything else. If the target is not several times the spread you will trade in, the rest of the work does not matter.
The sample is the day's movers, not the market. That table describes the symbols a change-ranked scanner selected. Stocks that were moving hard enough to be worth watching. It is not a description of the S&P 500, and it should not be read as one. It is, however, a description of exactly the population a day trading strategy actually trades.
Your fill is not the recorded book. The simulator uses the book as recorded, but a real order removes liquidity and invites reaction. The gap grows with your size, and it grows fastest in the same thin, fast conditions your strategy probably likes.
9. When nothing happens
No date in the list. The file is in the wrong folder, or the name does not match stock_1s_YYYYMMDD.db exactly. The app reads the asset class from the folder and the date from the filename.
Zero symbols in the file. Recording was on but the scanner never selected anything, or the connection dropped. Check the change floor and the price band first.
The run completes with zero trades. Usually the entry never became true. Loosen it drastically — Price > 0 fires on every tick — to confirm the plumbing works, then tighten in steps. This separates "my condition is too strict" from "my data is not loading".
Trades only in the first minute. A cumulative factor such as DayAmount starts near zero and grows, so a floor that is a real hurdle at 09:35 is no hurdle at 15:00, and a condition comparing against it behaves as a time-of-day filter you did not intend to write.
10. What to do next
Record a week. Five sessions is not statistics, but it is enough to see whether a result repeats at all, and it costs nothing except leaving the app running.
Then compare against a baseline rather than against zero. Write the dumbest entry you can. Something that fires often and holds briefly with a sensible exit — and run it on the same days. If your idea does not beat that clearly, the edge is in your exit rules rather than your entry, which is worth knowing early and cheap to find out.
Then run it forward rather than backward. Paper mode signs in to your real account and uses live prices with a virtual balance, so the strategy meets today's market instead of a recorded one, without risking anything. A rule that survives a backtest, a fresh week of recordings and a paper run is a rule worth a small amount of real money — in that order, and not in a hurry.
The factor reference lists every value a strategy can read, and the Strategy Library has free templates built from those names. Questions and corrections belong in the community.
Originally published by TraderWe on August 5, 2026. You may quote and link to this page. Republishing the full text without a link back to the original is not permitted.
The Alpaca IEX line hits home. I recorded a whole week of pre-market on the free tier once and built a gap strategy on it that looked incredible. Turns out I was testing on about four prints a morning. Not a data problem so much as me not reading what I had before I got excited about it.
Worth repeating the part people skim: the reason there's no equity sample file to hand you is licensing, not us being lazy about it. That does mean your first session is spent recording rather than testing, and yes, whichever broker you connect shapes what ends up in that file - depth, symbol limits, all of it. If you record a thin universe on a quiet session and the result looks great, that number is telling you about the session, not the strategy. Ask here if the recording check step is unclear, that's the bit we get the most questions on.
Worth adding that a recording gives you the book, not your fill. Whatever you backtest on ten levels, you still cross the spread on entry and exit, and on the smaller names that's where the whole number goes. Record the spread too and look at it before you trust anything.