Written to test a specific claim rather than to make money. Which is the point. The claim: sustained buying pressure precedes continuation.
1. The rule
# BUY — only when the claim's condition holds
if AvgStrength(300) > 120 and Strength > AvgStrength(300):
    if DayAmount > 5000000:
        Buy()
# SELL
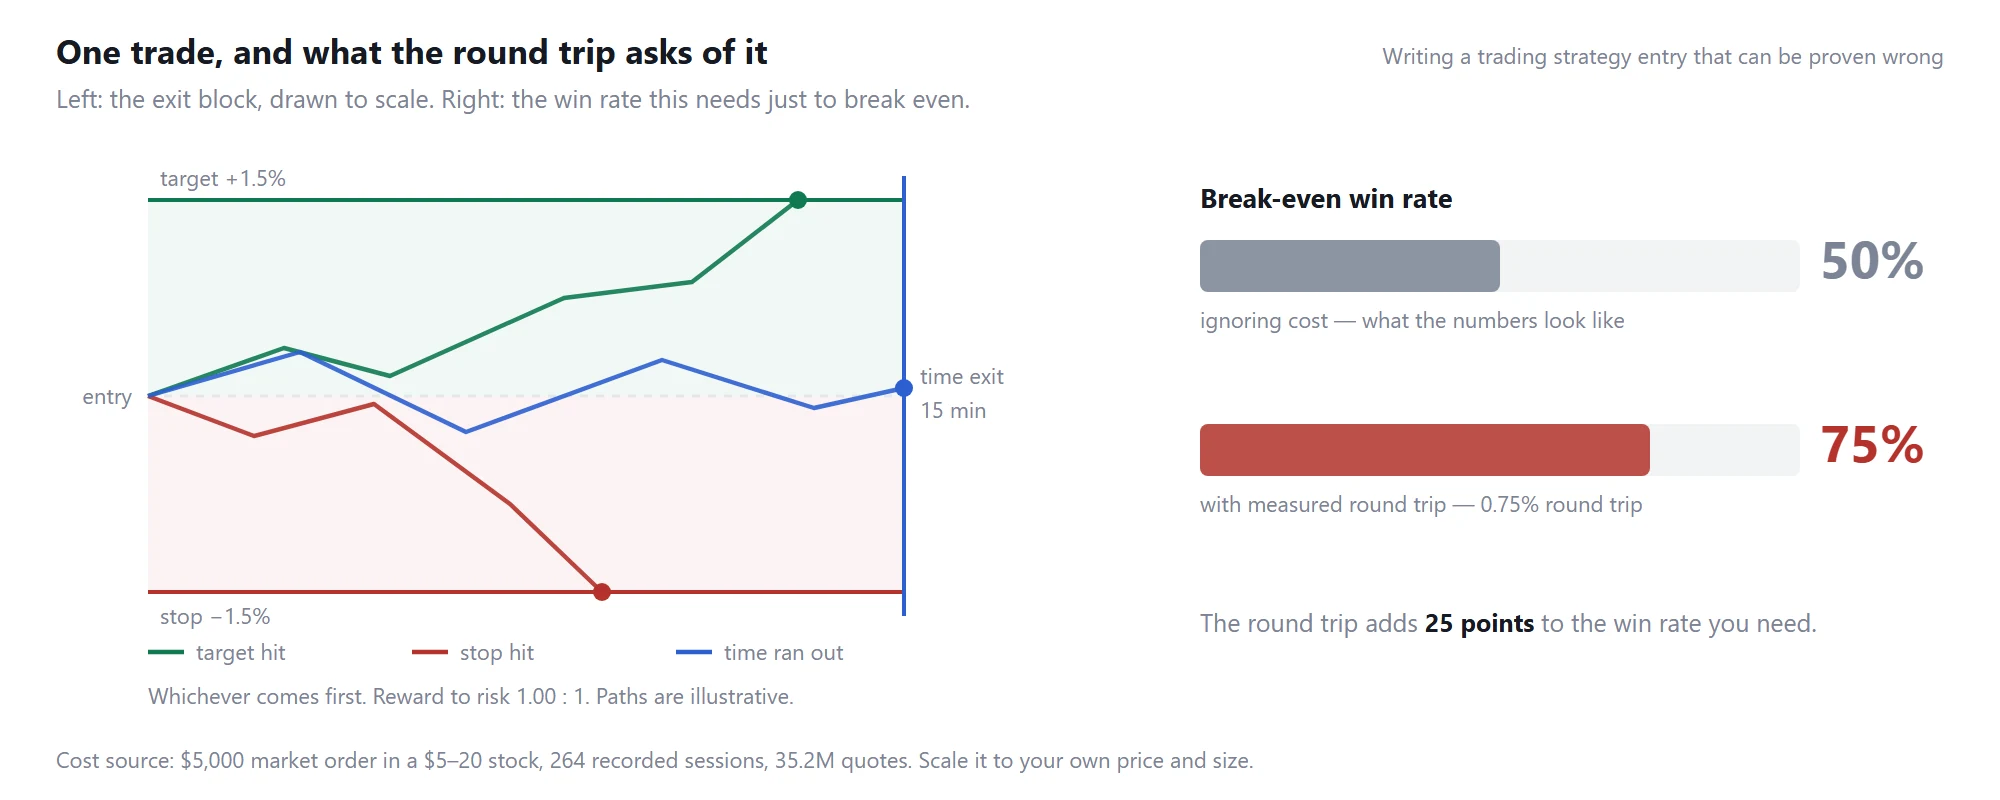
if ProfitPct >= 1.5 or ProfitPct <= -1.5 or HoldTime >= 900:
Sell()Symmetric target and stop on purpose, so the result reads as "was I right about direction" rather than being shaped by the payoff structure. If this doesn't beat the baseline, the claim is wrong and no amount of tuning fixes that.
2. What makes an entry falsifiable
The condition states a claim: buying pressure is currently above its own recent average, and
that average is itself elevated. Both parts are measurable at the moment of entry, so a losing
run has a specific meaning — the claim was true and the outcome still did not follow.
Compare that with an entry built from six tuned thresholds. When it loses you cannot tell which
part failed, so you tune again, and the loop never ends.
3. When it fails
It fails honestly, which is the point. It will produce losing periods where the condition held
and price went the other way. That is information; a strategy that cannot produce it is not
telling you anything.
4. What to change first
The comparison window. AvgStrength(300) is five minutes. Try 60 and 900, if the claim only
holds at one specific window, it is not a claim about the market, it is a claim about that
window.
5. What the round trip asks of it
Writing a trading strategy entry that can be proven wrong: the exit block drawn to scale, and the break-even win rate before and after measured trading costs
A symmetric target and stop looks fair and is not.
At 1.5% each way the break-even is exactly 50% before costs and 75% after the measured 0.75%
round trip. A coin-flip entry that you would expect to break even actually loses badly, and it does
so at a rate that a fifty-trade backtest will not reliably show you.
That is the strongest possible argument for writing entries you can falsify. If your hypothesis is
"this is better than random", the bar is not 50%. It is 75%, and you should decide in advance how
many trades it will take to tell those apart. See
what day trading a US stock really costs.
Educational template for research and backtesting. Not investment advice and not a signal service.
Originally published by TraderWe on July 24, 2026. You may quote and link to this page. Republishing the full text without a link back to the original is not permitted.
The window sweep is the part I'd do first too. 60 vs 300 vs 900 tells you more than any threshold tweak. Nice writeup, going to run the 60 version alongside my usual morning list.