Crypto Volatility Risk Premium: Two Thirds Gone Since 2024
By TraderWe· Published Oct 11, 2026· Updated Oct 11, 2026· 💬 0
Study details
Measured
1,957 start days per coin, 2021-03-24 to 2026-08-01, one 30-day window per start day; 3,914 windows in all
Instruments
Deribit DVOL index for BTC and ETH as the 30-day implied volatility, taken at the daily open; Binance spot hourly closes for the realized volatility of the 30 days that followed
Method
for every start day, score what a seller of 30-day variance at the DVOL level would have kept, (IV² − RV²) / (2·IV), in vol points. Split the sample at 2024-01-01, repeat the count year by year, and repeat it once more on windows that start on the 1st of each month so that none of them overlap
Result
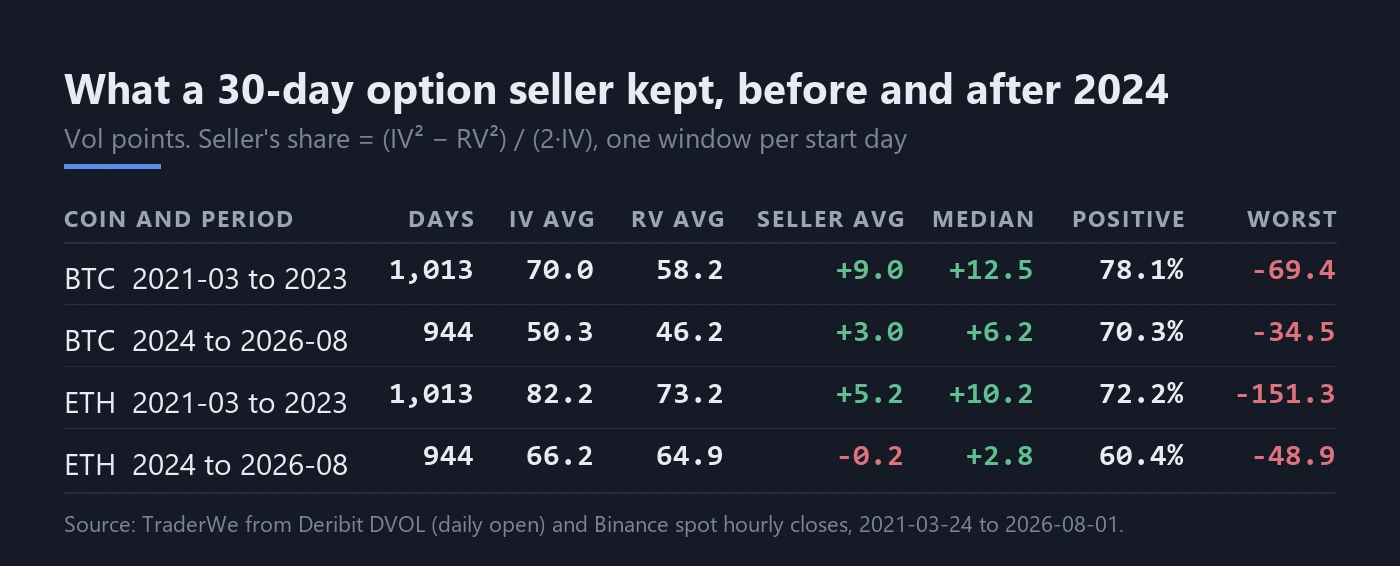
on BTC the average fell from +9.0 to +3.0 vol points and the median from +12.5 to +6.2, with the share of winning windows down from 78.1% to 70.3%. On ETH the average went from +5.2 to −0.2. On non-overlapping windows the recent BTC figure is +1.6 with a standard error of 1.9, which is not distinguishable from zero
Selling crypto options has a reputation as the trade that pays you to wait. Implied volatility sits above what the coin then actually does, the seller collects the difference, and every so often a crash takes a piece of it back. The reputation was earned in 2021 and 2022. The question is whether the premium is still there in the size people remember, and the answer from the index data is that most of it is gone.
This is a measurement of the volatility risk premium itself, not of a strategy. There are no option prices in it, no fills, no fees and no hedging. What it shows is the raw gap between implied and realized volatility that any option-selling strategy has to live off, and how that gap has changed since 2024.
1. What the seller's share measures
DVOL is Deribit's 30-day implied volatility index, published for BTC and ETH, and it is the cleanest public record of what option buyers were paying for volatility on a given day. We took its value at the daily open, 00:00 UTC, for every day from 2021-03-24 to 2026-08-01, and for each of those days we computed the volatility the coin then realized over the next 30 days from Binance spot hourly closes, as the square root of the sum of squared hourly log returns across the 720 hours, scaled to a year by 365 over 30.
A seller of 30-day variance at the DVOL level keeps IV² minus RV². Dividing that by 2·IV turns it into vol points, the same unit the index is quoted in, and makes it the first-order payoff of a vol swap or of a delta-hedged straddle sold at the money. We call it the seller's share. It is positive when the coin was quieter than the market priced and negative when it was wilder. It is an approximation of what a real option seller earns: a real book is path dependent, with gains and losses weighted by where the spot was when the moves happened, and this number ignores that. It is the right quantity for asking whether the premium exists, and the wrong one for claiming a return.
One window per start day means the windows overlap. Two consecutive days share 29 of their 30 days, so the 1,957 rows per coin are far fewer than 1,957 independent observations. The daily figures are the complete picture; the independent count is in section 4.
2. The two halves
The sample splits naturally at 2024-01-01: the earlier half contains the 2021 bull market, the 2022 collapse and the 2023 recovery, and the later half contains the spot ETF era. The split was chosen before the numbers were looked at, and it is the only split reported.
On BTC the average seller's share went from +9.0 vol points to +3.0, a drop of two thirds. The median went from +12.5 to +6.2. The share of start days whose window ended positive went from 78.1% to 70.3%. Both implied and realized volatility fell between the halves, from 70.0 to 50.3 on the implied side and from 58.2 to 46.2 on the realized side, so the premium shrank in absolute terms and in proportion: implied ran 11.8 vol points above realized in the first half and 4.1 above it in the second.
On ETH the premium has gone. The average went from +5.2 to −0.2 vol points, the median from +10.2 to +2.8, and the share of positive windows from 72.2% to 60.4%. A median of +2.8 with an average of −0.2 is the signature of a trade that wins small most of the time and loses larger: in the recent half the average positive window on ETH kept 9.2 vol points and the average negative window gave back 14.4. BTC has the same shape in milder form, 8.3 against 9.7.
The worst windows are a reminder of what the negative tail looks like. The worst BTC start day was 2021-05-01, when DVOL opened at 75.1 and the coin then realized 126.7, a seller's share of −69.4 vol points. The worst ETH start day was 2021-04-29, implied 88.9, realized 186.6, a share of −151.3. One day in twenty was at −23.6 or worse for BTC in the first half and −19.3 or worse in the second; for ETH the same cut sits at −46.9 and −29.3. The tail got shorter along with the premium, which is what lower volatility does, but it did not go away in proportion to the premium.
3. Year by year
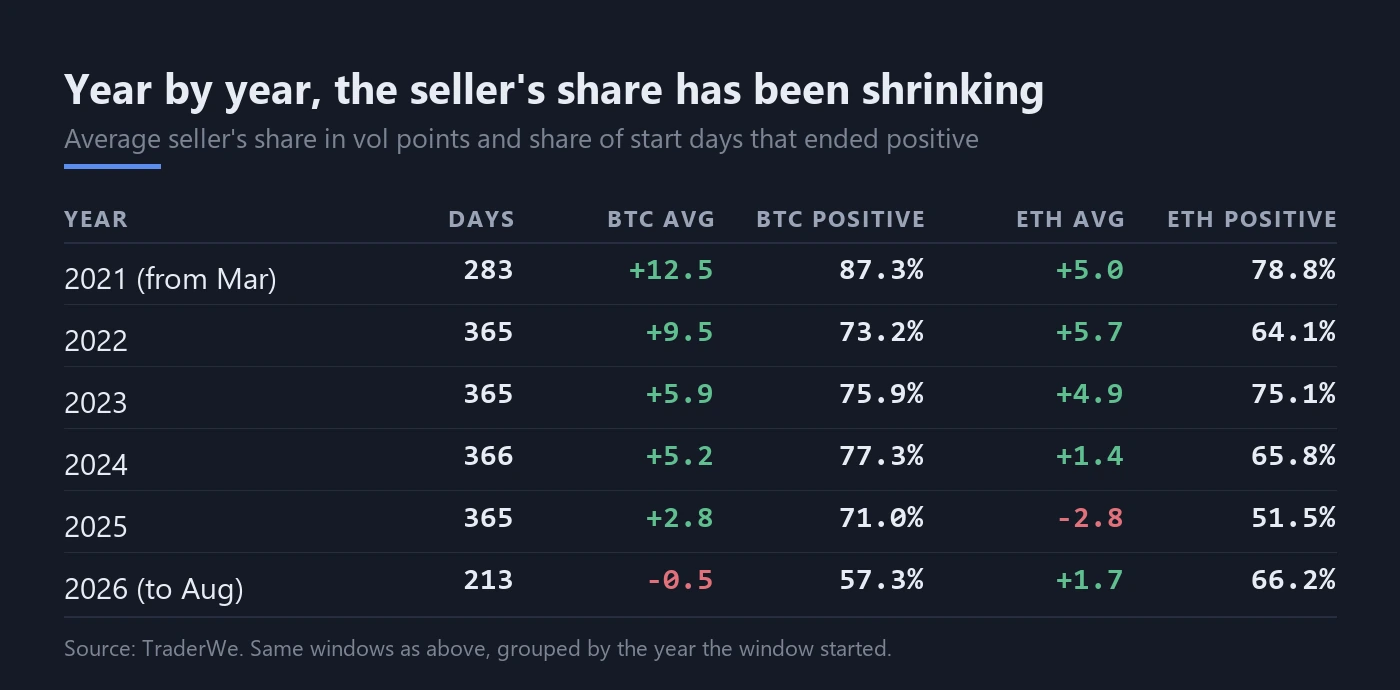
A split into two halves can hide a single bad year. Grouping the windows by the year they started shows the decline is a trend, not an event.
BTC goes +12.5, +9.5, +5.9, +5.2, +2.8 and then −0.5 for the part of 2026 we have, which is the 213 start days through 2026-08-01. The share of positive windows holds between 71.0% and 87.3% through 2025 and then drops to 57.3% in 2026. Every year is lower than the one before it. ETH held between +4.9 and +5.7 through 2023, fell to +1.4 in 2024, went negative at −2.8 in 2025 with barely half of windows positive at 51.5%, and sits at +1.7 for 2026 so far.
Note that the 2021 row covers only 283 start days, from March, and the 2026 row only 213. The remaining years are full.
4. The windows that do not overlap
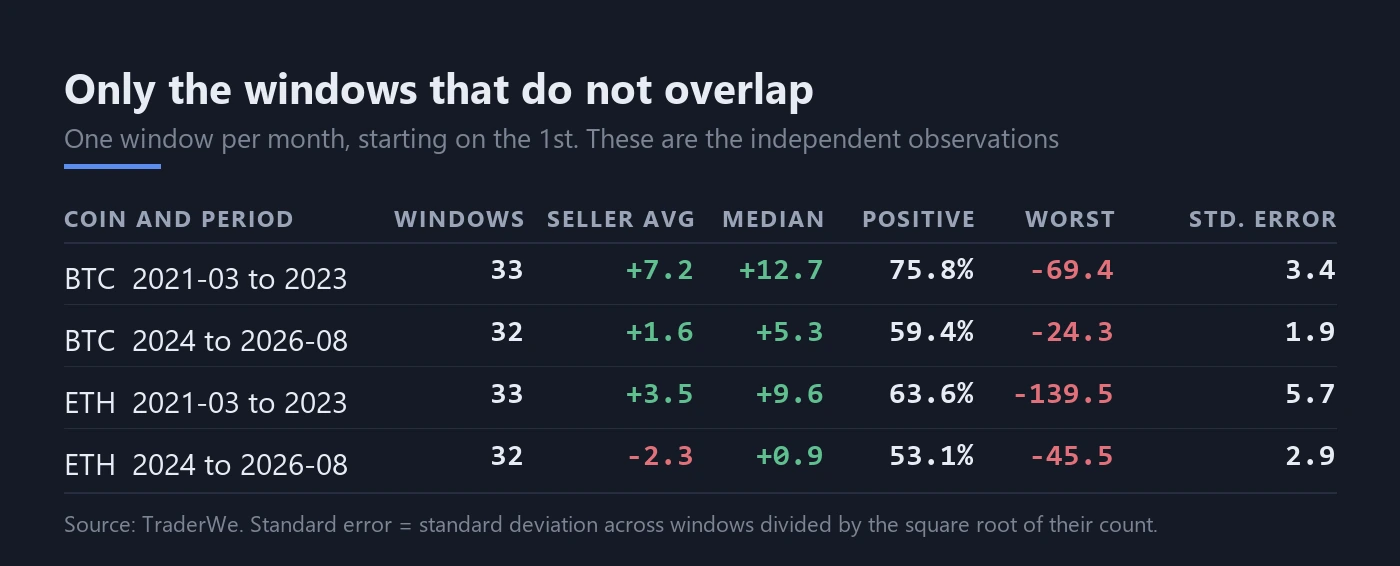
To get an honest count of independent observations we kept only the windows that start on the 1st of a month. That leaves 33 windows per coin in the first half and 32 in the second, and it lets us put a standard error next to each average.
For BTC in the first half the average is +7.2 vol points with a standard error of 3.4, so the premium was there at roughly two standard errors. In the second half the average is +1.6 with a standard error of 1.9. That is not distinguishable from zero. The median of +5.3 says the typical month still paid a little, and the share of positive months at 59.4% says it paid in six months out of ten, but the average that a seller actually banks over the period is within noise of nothing, because the four months in ten that lost gave back more than the six that won, the worst of them −24.3.
For ETH the second-half average is −2.3 with a standard error of 2.9 and the median is +0.9. There is nothing to sell. The first-half figure of +3.5 with a standard error of 5.7 was never significant either on this count; ETH's reputation as a premium seller's coin rested on the overlapping daily figures and on the 2021 median, and the independent windows do not support it even for the early period.
5. What this does and does not establish
It establishes that the gap between implied and realized volatility on BTC, measured on the public index, is about a third of what it was through 2023, and that on ETH it has closed. It establishes that the decline is monotonic by year on BTC. And it establishes that on the independent monthly count, the recent BTC premium is within noise of zero.
It does not establish what an option seller would have earned. There are no option prices in this measurement, so there is no bid-ask spread, no fee, no margin cost and no delta-hedging cost in it, and all of those come out of a premium that is now about 3 vol points on the daily figures and 1.6 on the independent ones. The seller's share formula is a first-order approximation that ignores the path of spot inside each window; a real short-gamma book in May 2021 would have fared differently from the −69.4 that the formula reports, and not necessarily better. DVOL is an index rather than a tradable quote, and the realized leg is computed from spot rather than from the perpetual that most delta hedges run on. The 2026 row is incomplete. And the sample is five years of a market that has changed its participants twice in that time, so the next five are not promised to look like the last two.
The practical reading is narrow. If the plan is to sell crypto volatility because it has historically paid, the historical number that supported the plan has shrunk by two thirds on BTC and has gone on ETH, and the independent count cannot tell the recent BTC figure from zero. Whatever edge a specific strategy claims from here has to come from something other than the index-level premium, and it has to be measured against option prices, with costs, before it is counted.
Originally published by TraderWe on October 11, 2026. You may quote and link to this page. Republishing the full text without a link back to the original is not permitted.