Do crypto trading bots make money? 46,870 accounts
By TraderWe· Published Oct 1, 2026· Updated Oct 11, 2026· 💬 0
Study details
Measured
a September 2026 snapshot of the public Hyperliquid leaderboard, 46,870 accounts; 15,120 worth $1,000 or more that traded during the month, plus the raw fills of 40 accounts
Instruments
Hyperliquid perpetual futures. Monthly profit, monthly volume and account value as the venue publishes them, and each account's own fills
Method
divide monthly volume by account value to get turnover, bucket the accounts by it, and report how many finished in profit and what the bucket made in total. Separately, take the 40 largest monthly profits among accounts that were profitable on every published window, pull their fills, and classify each one by what it actually did rather than by what it is called
Result
profitability falls monotonically with turnover, from 84.6% under 3x to 15.0% above 3,000x, and the two fastest buckets lost money in aggregate. Of the 40 most profitable accounts, 35 were taking direction and 4 were making markets
There is a public leaderboard of every account on Hyperliquid, with monthly profit and monthly
volume next to each name. It is the closest thing crypto has to an audited record of who is making
money, and it gets screenshotted constantly.
We pulled all 46,870 rows and checked the arithmetic before reading anything into it.
1. The first thing the leaderboard does is add up wrong
Trading perpetual futures is close to zero sum. Before fees, one side's gain is the other side's
loss, so a complete list of participants should add up to roughly nothing, and after fees to
something negative.
It does not. Among the accounts worth at least $1,000 that traded during the month, the published
profits sum to plus $413.9M, and 69.4% of them are in profit.
That is not a market where most people win. It is a list with the losers removed. An account that
blows up stops having an account value, drops off the ranking, and takes its loss with it. Every
number below sits on top of that, and it is the main reason to be careful with any conclusion drawn
from a leaderboard, ours included.
2. More than a third of the leaderboard was not trading
Before comparing traders, you have to find them. Of the accounts worth $1,000 or more, 9,132 of them,
37.7%, did no trading at all in the month. They carry plus $1,764.9M of profit between them, and
85.7% of them are up.
That is not trading performance. It is the mark-to-market on coins somebody is holding. Leave them in
and they drown out everything else, which is exactly what happens when a leaderboard is read as a
scoreboard of strategies.
Everything from here on is the 15,120 accounts that actually traded.
3. Profitability falls as turnover rises, with no exception
Turnover is monthly volume divided by account value. An account that traded a hundred times its
own size during the month turns over a hundred times, which is a working definition of how hard a
bot is running.
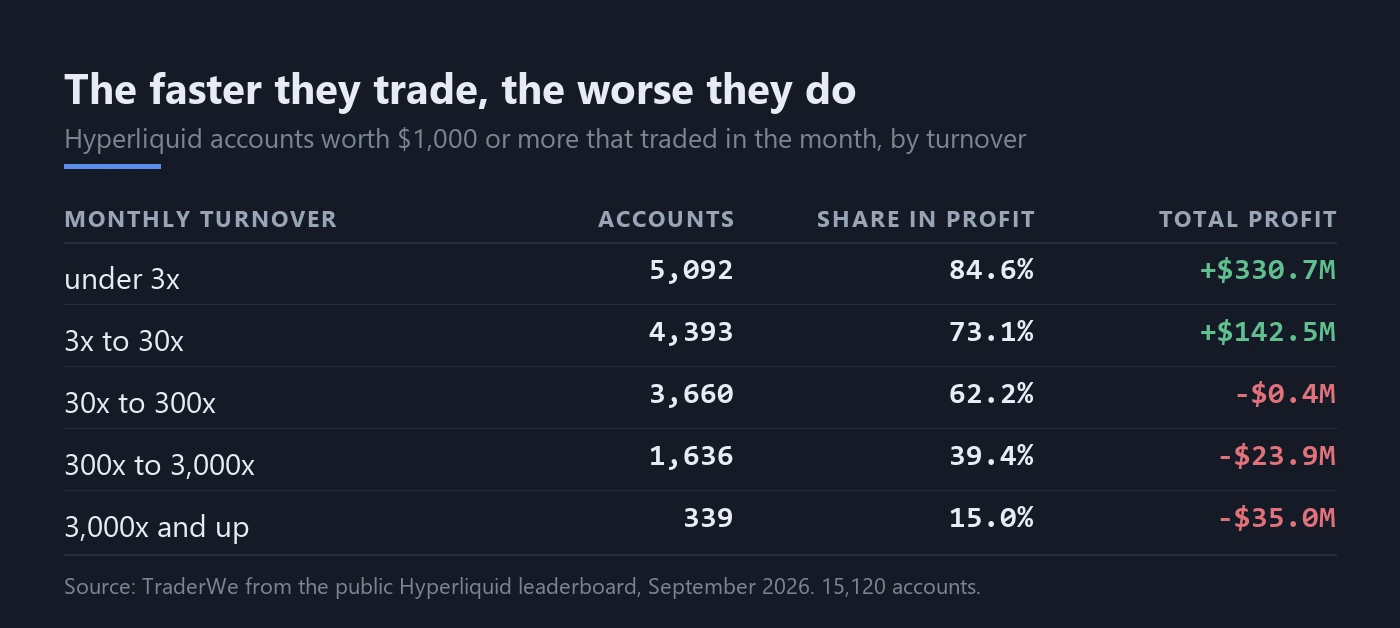
The ordering is clean and it runs the whole way. Under 3x, 84.6% of accounts finished the month in
profit. Above 3,000x, 15.0% did, and that bucket lost $35.0M between 339 accounts. The two fastest
buckets are negative in aggregate; the slowest two hold essentially all of the profit on the list.
Read with section 1 in mind, this is worse than it looks for the fast accounts, because the
survivorship that flatters everyone flatters them too.
There is an honest objection to the top row. An account turning over less than 3x a month is barely
trading, and in a month when coins went up, being long and doing nothing is a winning strategy that
has nothing to do with skill. That is probably a large part of the plus $330.7M. The finding is not
that slow trading is good. It is that fast trading, on this venue, in this month, was not.
4. What the most profitable accounts were actually doing
Aggregates can hide a working strategy, so we went the other way: take accounts that were profitable
on every window the venue publishes, worth at least $100,000, turning over at least 30x, and pull the
actual fills of the 40 with the largest monthly profit.
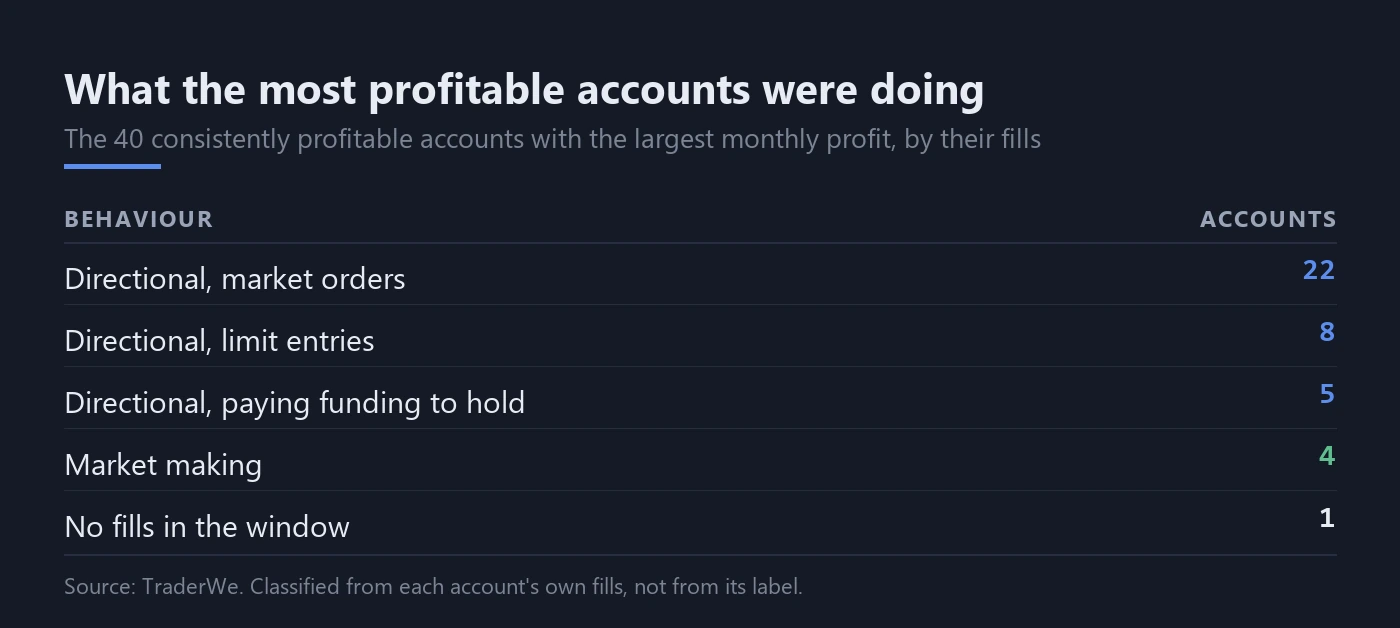
Thirty-five of the 39 with fills were taking direction. Not arbitrage, not spread capture, not a
funding trade: positions in a handful of coins, mostly long, mostly entered with market orders, with
a median hold measured in hours rather than seconds. Their top three coins account for between 33%
and 100% of their volume. The ones with enormous fill counts were slicing orders, not trading fast.
One group is worth naming because our own classifier got it wrong first. Five accounts were tagged as
collecting funding. They were not: all five paid funding, between $35,502 and $91,017 over the window.
They were holding directional positions through the funding clock and paying for the privilege. The
label said one thing and the fills said another, which is the whole reason to read fills.
5. The four that were really making markets
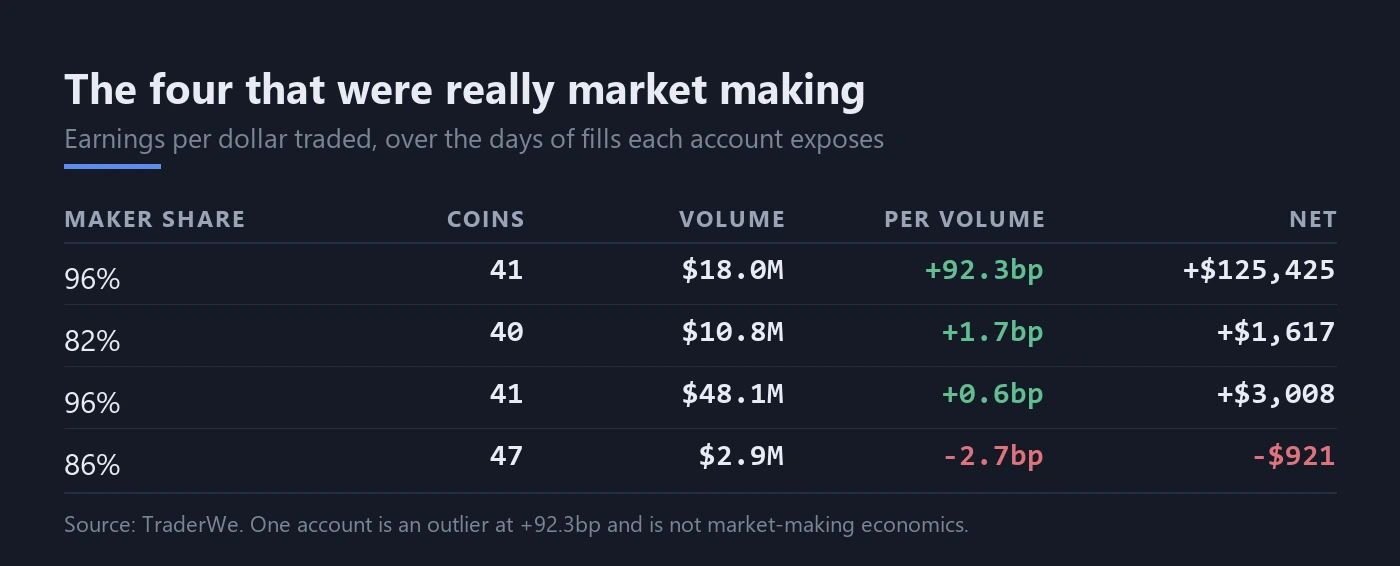
Four accounts in the top 40 were doing what people mean by a trading bot: resting quotes, 82% to 96%
of their volume as the passive side, across 40 to 47 coins, holding for minutes.
The middle two are the honest picture of the business. One made $3,008 on $48.1M of volume, which is
0.6 basis points per dollar traded. Another made $1,617 on $10.8M, 1.7 basis points. The fourth lost
$921 on $2.9M. These are rebate-and-latency economics, and the number that decides them is not a
signal, it is cost per unit of flow.
The top row is an outlier and we are not going to pretend otherwise. Plus 92.3 basis points per
dollar traded is not market making; something else is going on in that account, most likely a
directional position worked passively, and one account is not evidence of anything.
6. What this does not establish
It does not say bots cannot work. It says that on one venue, in one month, among the accounts the
venue chose to show, the profitable ones were mostly taking direction, and the ones trading fastest
lost money.
It especially does not say you should copy the winners. They were selected on the outcome. In a
month with 15,120 trading accounts, the top of the list is where luck and skill are least
distinguishable, and the same selection that put them there removed everyone who took the other side
of their trades.
If we revisited this, the honest design would be to pick accounts on behaviour first, turnover and
maker share, and only then look at what they earned over several months. Picking on the result and
then explaining it is how leaderboards become strategies.
Limitations
One venue, one snapshot, one month. The leaderboard is a photograph taken on one September 2026 day and we have
no history of who was on it before.
Survivorship is not a footnote here, it is the dominant bias, and we cannot size it. Nothing in the
public data tells us how many accounts were liquidated out of the ranking during the month.
Fill histories are capped. The busiest accounts expose only their most recent fills, so for the
fastest ones we are reading a few days rather than the full month, and the per-volume figures in
section 5 cover only the window each account exposes.
Account value is a point-in-time number and turnover divides by it. An account that added or withdrew
capital during the month will have a turnover figure that misstates how hard it was working.
The classification is ours and it is imperfect, as the funding group shows. We report the categories
because the fills support them, not because a label was attached to the account.
Originally published by TraderWe on October 1, 2026. You may quote and link to this page. Republishing the full text without a link back to the original is not permitted.