- One day, and a calm one — spreads widen and depth evaporates in stress, and depth faster
- Ten recorded levels only; we cannot say what sits beyond level ten, so unfillable rates are an upper bound
- Every figure is computed against a book that did not know an order was coming — a real order removes liquidity
- Funding costs are not included, so the spot-versus-perpetual comparison covers entry cost only
- Our universe leans toward names that move; a majors-only universe would show lower costs throughout
Most cost discussion stops at the spread. The spread is the cost of the smallest possible order,
and almost nobody trades the smallest possible order. What you actually pay depends on how far
your order eats into the book, and that is a different number on every venue and every symbol.
This is one full day, five venues, every symbol we record, measured from the same files we
published on the Downloads board. You can rerun all of it.
1. What the quote costs
Spread first, because it is the floor. Nothing you do gets you below it when you cross.
| Venue | Market | Symbols | Median spread | Middle half of symbols |
|---|
| Binance Futures | perpetual | 64 | 3.0 bp | 1.5 – 14.0 |
| Kraken | spot | 29 | 3.4 bp | 1.6 – 7.5 |
| Kraken Futures | perpetual | 32 | 4.8 bp | 1.5 – 9.6 |
| Coinbase | spot | 51 | 5.9 bp | 1.9 – 17.2 |
| Coinbase International | perpetual | 30 | 8.1 bp | 4.6 – 14.5 |
One basis point is 0.01%. Crossing a 3 bp spread costs 0.03%; a round trip costs 0.06%.
The median is the least interesting number in that table. Strategies do not trade the median
symbol — scanners pick movers, and movers are disproportionately the thin names. The share of
symbols that are expensive matters more:
| Venue | Above 10 bp | Above 25 bp | Worst symbol |
|---|
| Coinbase International | 47% | 20% | 370 bp |
| Coinbase | 37% | 20% | 357 bp |
| Binance Futures | 33% | 17% | 1250 bp |
| Kraken | 24% | 14% | 370 bp |
| Kraken Futures | 23% | 13% | 370 bp |
On the widest venue nearly half the symbols cost more than 0.2% for a round trip. The worst
symbol we recorded quoted at 1250 bp — 12.5% one way. A strategy targeting 1% cannot trade that
symbol at any frequency, and no amount of signal quality changes that.
Spread barely moves with the clock
Equity traders expect a U-shape: wide at the open, tight midday, wide into the close. Crypto has
no session and the data shows it. Median spread by hour, basis points:
| Hour (ET) | Coinbase | Kraken | Binance F | Coinbase Intl | Kraken F |
|---|
| 00 | 3.2 | 2.4 | 1.6 | 5.3 | 2.6 |
| 03 | 3.1 | 2.7 | 1.6 | 5.7 | 2.8 |
| 06 | 3.4 | 2.2 | 1.6 | 5.6 | 3.0 |
| 09 | 3.0 | 2.4 | 1.8 | 6.7 | 3.8 |
| 12 | 3.0 | 2.6 | 1.6 | 6.0 | 3.5 |
| 15 | 3.0 | 2.2 | 1.6 | 6.3 | 3.4 |
| 18 | 3.7 | 1.8 | 1.5 | 4.6 | 3.5 |
| 21 | 3.0 | 3.0 | 1.6 | 6.8 | 6.2 |
Binance held between 1.5 and 1.8 bp for twenty-four hours. The practical consequence is that a
crypto strategy does not need a time-of-day cost model the way an equity strategy does. It
badly needs a per-symbol one.
2. What the book holds
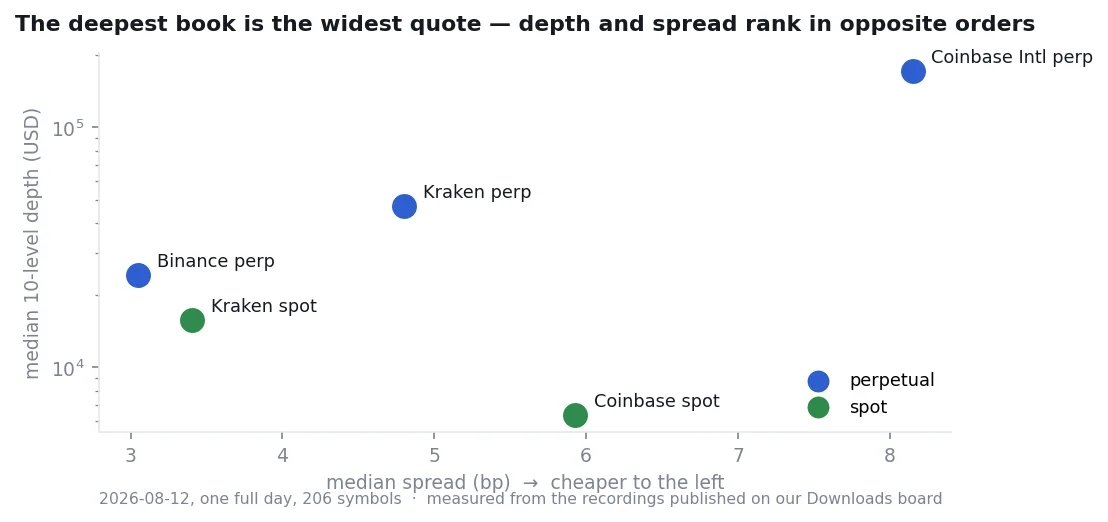
Depth is the other half and it ranks almost exactly opposite.
| Venue | Median 10-level depth | Median spread |
|---|
| Coinbase International | $172,335 | 8.1 bp |
| Kraken Futures | $47,228 | 4.8 bp |
| Binance Futures | $24,274 | 3.0 bp |
| Kraken | $15,820 | 3.4 bp |
| Coinbase | $6,341 | 5.9 bp |
Read those two columns together. Coinbase International has the deepest books of the five and
the widest quotes. Binance perpetuals have the tightest quotes and roughly one seventh the
depth. The gap between deepest and thinnest is
27x.
This is not a contradiction. Spread is set by whoever is willing to quote the smallest
increment; depth reflects how much capital wants to sit on that book. Nothing forces them to
move together, and in our sample they did not.
3. What your order actually pays
Here is the measurement that matters and the one almost nobody runs. For each recorded minute,
we take a market buy of a given size, walk it down the recorded ask ladder, and compare the
resulting average fill against the midpoint at that instant.
| Venue | $1,000 | $5,000 | $25,000 | $100,000 |
|---|
| Binance Futures | 0.7 bp | 0.9 bp | 1.1 bp | 2.0 bp |
| Coinbase | 1.3 bp | 2.2 bp | 2.9 bp | 6.1 bp |
| Kraken | 1.4 bp | 2.2 bp | 3.1 bp | 7.4 bp |
| Kraken Futures | 2.5 bp | 3.4 bp | 5.4 bp | 4.5 bp |
| Coinbase International | 2.6 bp | 3.1 bp | 4.4 bp | 6.3 bp |
Those numbers look reassuringly small, and they are
badly misleading on their own. They are
medians over the cases where the order could be filled inside ten levels. The cases where it
could not are excluded. Which is precisely the expensive scenario.
So here is the number that matters:
| Venue | $1,000 | $5,000 | $25,000 | $100,000 |
|---|
| Coinbase | 16.3% | 35.7% | 64.9% | 84.2% |
| Kraken | 0.0% | 7.7% | 59.6% | 76.7% |
| Kraken Futures | 0.1% | 1.9% | 25.9% | 74.4% |
| Binance Futures | 3.5% | 15.5% | 41.1% | 60.0% |
| Coinbase International | 0.0% | 0.5% | 3.3% | 20.6% |
Share of symbol-minutes where the order could not be filled within the ten levels we record.
At a $25,000 clip on Coinbase spot, nearly two thirds of the time the visible book does not hold
your order. On Coinbase International the same clip fails 3% of the time. That is the depth
ranking asserting itself, and it is the opposite of the spread ranking.
Reading the two tables together
For a $1,000 clip, Binance is cheapest on both measures and the choice is easy.
For a $25,000 clip, Binance still shows the lowest cost *when it fills* — but it fails to fill
41% of the time, against 3% on Coinbase International. A cost number you receive on 59% of
attempts is not comparable to one you receive on 97%.
That is the core practical point of the whole measurement: **as size grows, availability
replaces price as the binding constraint.** Backtests almost never model this. They fill at the
touch, or at the touch plus a fixed slippage constant, and both assumptions quietly get more
wrong as your size grows.
4. Spot or perpetual
We paired 38 coins quoted on both the spot and perpetual market of the same venue.
- The perpetual book was
deeper in 33 of 38 pairs
- The perpetual spread was
tighter in only 6 of 38
| Venue | Coin | Spot spread | Perp spread | Spot depth | Perp depth |
|---|
| Kraken | CRV | 7.5 bp | 7.5 bp | $5,008 | $82,366 |
| Coinbase | ENA | 11.2 bp | 11.2 bp | $12,432 | $144,095 |
| Kraken | XLM | 6.2 bp | 6.2 bp | $9,850 | $24,929 |
| Coinbase | DOGE | 13.9 bp | 14.0 bp | $197,902 | $382,568 |
| Coinbase | FARTCOIN | 7.6 bp | 14.5 bp | $145,467 | $116,925 |
CRV is the typical shape: identical quoted spread, sixteen times the depth. The perpetual is not
cheaper to touch. It is cheaper to fill in size.
FARTCOIN is the counterexample and it is worth showing — wider *and* shallower on the perpetual.
The pattern is a tendency, not a law.
Funding is not in this comparison and it matters. A perpetual position pays or receives
funding for as long as it is open. Over a holding period of days that can dwarf both the spread
and the depth advantage, and our recordings do not carry funding rates, so we did not measure it.
Treat this section as entry-cost only.
5. Turning this into a threshold you can use
The reason to measure any of this is to set a number in a strategy. Three ways to use it:
A liquidity gate on the spread. The condition is a ratio, not an absolute:
if (Ask1 - Bid1) / Price < 0.002 and DayAmount > 10000000:
    Buy()
Two thousandths is 20 bp, a round trip of 0.4%. Whether that is right for you depends entirely
on your target: for a 1% target it is 40% of the move, which is not a filter, it is a decision to
lose. Set the threshold from your target, not from convention.
A depth gate for size. If your clip is meaningful relative to the book, the spread is
decoration and the ladder is the cost. The visible proxy:
if TotalBidSize * Price > 50000 and TotalAskSize * Price > 50000:
    Buy()
A cost floor in the backtest. Whatever your simulator assumes, check it against a number
from your own recording rather than a constant you read somewhere. If your backtest fills at the
touch and your measured cost at your clip size is 5 bp, every result is optimistic by 10 bp per
round trip, compounding with trade frequency.
6. What this does not tell you
One day, and a calm one. Spreads widen and depth evaporates in stress, and depth evaporates
faster. Treat these as a ranking of normal conditions, not as constants.
Ten levels is not the whole book. We record ten. Beyond that we cannot say what is there,
and the "unfillable" figures above would improve with a deeper record. The ranking between
venues would likely survive; the absolute percentages would not.
Your order changes the book. Every number here is computed against a book that did not know
you were coming. A real order removes liquidity and invites reaction. This is a floor on your
cost, not an estimate of it.
Our universe, not yours. These venues are recorded with our symbol selection, which leans
toward names that move. A universe of majors only would produce lower costs and lower unfillable
rates across the board.
The recordings are free on the Downloads board. The genuinely useful version of this exercise is
the one you run on your own symbols at your own clip size. What we can offer is the method and
a reference point.