- One day, one recording setup, our universe selection — a majors-only universe would show far less
- The definition is strict (price and both sides identical for 5+ minutes) and therefore undercounts
- One-minute resolution hides shorter stalls that matter to fast strategies
- Cause cannot be separated from the recording — an inactive market, a trade-triggered subscription, a rate limit and a dropped connection all look identical
A stale quote does not raise an error. Your code reads a number, the number is plausible, and
nothing anywhere says it was last updated eleven minutes ago. This is the defining property of
the problem and the reason it survives in production systems for years: **absence of data and
absence of movement produce the same value.**
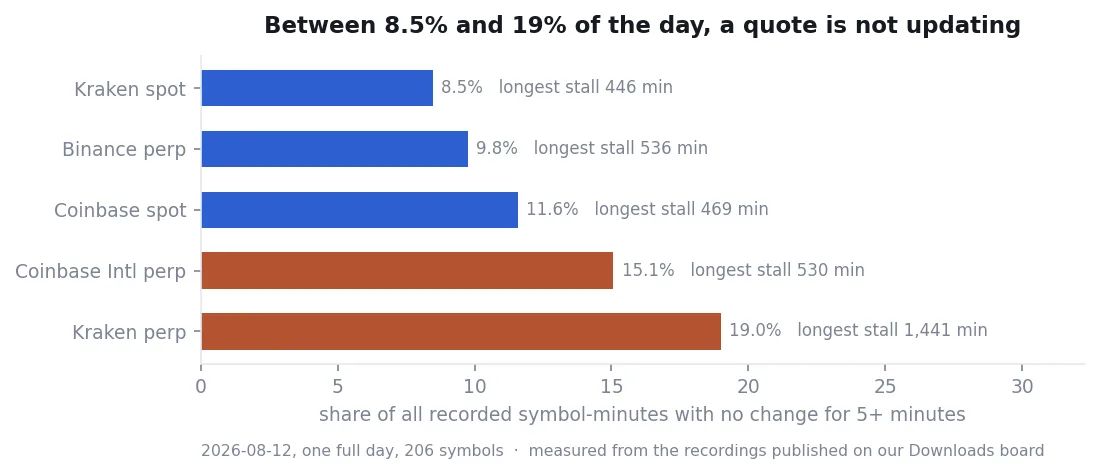
We had been treating this as an occasional quirk on one venue. Measuring it across five venues
showed it is neither occasional nor venue-specific.
1. How much of the day is stale
| Venue | Symbols | Stalls of 5+ min | Share of all minutes | Longest single stall |
|---|
| Kraken Futures | 32 | 205 | 19.0% | PF_PEPEUSD, 1441 min |
| Coinbase International | 30 | 334 | 15.1% | 1000PEPE-PERP-INTX, 530 min |
| Coinbase | 51 | 565 | 11.6% | PENGU-USD, 469 min |
| Binance Futures | 64 | 446 | 9.8% | 1000PEPEUSDT, 536 min |
| Kraken | 29 | 249 | 8.5% | PUMP-USD, 446 min |
PF_PEPEUSD deserves its own sentence. It did not change once in the entire recording. It was in
the universe, it had a quote, and it was not a market. A scanner running every minute evaluated
it 1,441 times and every evaluation used the same numbers.
Note also that the venue with the tightest quotes in our companion cost measurement, Binance
perpetuals — sits mid-table here. Quote quality and update quality are separate properties. A
venue can be excellent at one and unremarkable at the other, and vendors advertise neither.
2. What a stall actually does to your logic
The failure is rarely that the strategy trades on a stale price. It is that every derived value
built from the stall is wrong in a way that looks fine.
Moving averages absorb it silently. An average over sixty minutes where twenty of them are
frozen is not an average of the market, it is an average weighted toward one instant that
happened to repeat. It will look smooth. Smoothness is the symptom.
Volatility collapses toward zero. A stalled window has no variance. Any regime filter reading
"volatility is low, conditions are calm" will pass exactly when it has no information at all,
which is the worst possible moment to be permissive.
Change-rate and angle factors go flat, then spike. When the feed resumes, the whole
accumulated move arrives in one tick. A momentum condition that would never have fired on the
real path fires on the artifact.
Order-book conditions freeze in whatever state they were in. A bid-ask imbalance that looked
attractive when the feed stopped stays attractive for as long as the stall lasts. If your entry
waits for that condition, it will wait forever and then take the trade at the worst moment.
The common thread: a stall does not produce missing values that your code would notice. It
produces plausible values that your code consumes happily.
3. Why the count is higher than intuition suggests
The symbols that stall are the ones you would guess — small caps, meme pairs, anything with long
gaps between trades. If you trade majors exclusively you will rarely meet this.
But universe scanners do not only pick majors. That is the point of a scanner: it finds names
that are moving, and names that move sharply are disproportionately names that are thin the rest
of the time. The same selection that makes a scanner useful also loads it with the symbols most
prone to this failure.
There is a second reason worth naming. The venues most likely to list a long tail of new,
illiquid pairs are also the venues where a strategy might find an edge, because fewer
participants are looking. The stall rate is part of the price of fishing there.
4. Detecting it
The check is trivial once you decide to treat staleness as a state rather than a value.
Track, per symbol, the last tick at which anything actually changed. In the TraderWe DSL the
building block is the "N ticks ago" suffix available on any column:
# skip this symbol if price and both sides of the quote are unchanged from 5 ticks ago
if Price != PriceN(5) or Ask1 != Ask1N(5) or Bid1 != Bid1N(5):
    if ChangePct > 3 and Strength > 120:
        Buy()
Three design points that follow from the data:
Reject on age, not on value. The symbol is untradeable this tick because the information is
old, regardless of how good the setup looks. Do not try to judge whether the stale value is
"still probably right" — that judgement is exactly what the data cannot support.
Choose the threshold from your holding period, not from a round number. A strategy holding
ten minutes can tolerate a thirty-second stall. A strategy holding thirty seconds cannot. Five
minutes, which we used as the measurement definition, is far too loose to be a trading rule.
Do not compute indicators across a stall. If your averaging window spans a frozen stretch,
either skip the symbol or mark the value as unreliable. Producing a number is not the same as
producing a measurement.
5. Logging it, and why that pays
Count your stalls per session and store the number. It costs nothing and it converts an argument
into a test.
"The strategy is worse on volatile days" and "my feed drops more on volatile days" produce
identical equity curves and completely different fixes. Without a stall count you will pick
whichever explanation matches your priors, and most people pick the one that blames the strategy
because it feels more rigorous.
If bad days correlate with stall frequency, some portion of what you have been calling
performance is connectivity.
6. Method and limits
One day, one recording setup, our universe. A universe of majors would produce much lower
numbers. This measures our symbol selection as much as it measures the venues, and we would
expect any long-tail universe to look similar.
The definition is deliberately strict and therefore undercounts. We require price and both
sides identical for five consecutive minutes. A symbol whose bid ticks once every eight minutes
while nothing else moves is not counted here, and it is not healthy either.
One-minute resolution hides short stalls. Our one-second recordings show stalls far shorter
than a minute that never appear in this measurement. For a fast strategy those are the ones that
matter.
We cannot separate causes. A stall can be an inactive market, a subscription that only pushes
on trades, a rate limit, or a dropped connection. From the recording they are identical. Our
earlier note on Kraken ticker behaviour covers one specific mechanism where the cause was
identifiable; in general it is not.
The recordings are on the Downloads board. If you want to run a stricter definition, a shorter
window, or your own symbol list against the same data, everything needed is in those files.