46% of a recorded trading day contained no new information: market data quality measured
By TraderWe· Published Aug 16, 2026· Updated Aug 17, 2026· 💬 3
Study details
Measured
2025-04-02 – 2026-07-31, 264 recorded sessions; 3.13 million qualifying symbol-minutes
Instruments
US equities; two watchlist setups — 15 fixed symbols and a 30-slot scanner
Method
count minutes with no increase in traded value and no change in the best bid or offer, counting only minutes where the symbol was in the universe and the quote was not crossed
Result
46% of regular-hours minutes carried nothing at all under a fixed watchlist, against 8% with a scanner picking the day's movers
A backtest treats every minute in the file as a minute of market. Most of them are not. In a large share of them nothing traded, the quote did not move, and a strategy evaluating a rule against that minute was evaluating it against yesterday's information wearing a fresh timestamp.
We measured how large that share is across 264 recorded US equity sessions. The answer turned out to depend far less on the market than on a decision we made in a settings screen.
1. What counts as a dead minute
A minute counts only if the symbol was in our universe at the time, the recording was actually running, and the quote was not crossed. That last condition matters: during a trading halt the bid can sit above the ask because the quotes are indications for the reopening auction rather than executable prices. Counting halts as stale data would be measuring the market's pauses rather than our data.
Within those minutes we ask two separate questions.
Did anything trade? The cumulative traded value either increased during that minute or it did not.
Did the quote move? The best bid and best offer are either different from the previous observation or identical to it.
A minute where both answers are no is a dead minute. No trade, no quote change, nothing a strategy could have reacted to. A run of five or more consecutive dead minutes is a stall.
We deliberately do not use the last-price field for any of this. A last trade price is a past event and can sit outside the current quote for entirely ordinary reasons — the stock has not traded today, the book moved after the print, a block crossed away from the market. We spent a while treating that as a data fault before establishing that it was not one, which is its own lesson about market data.
2. How much of a day is dead
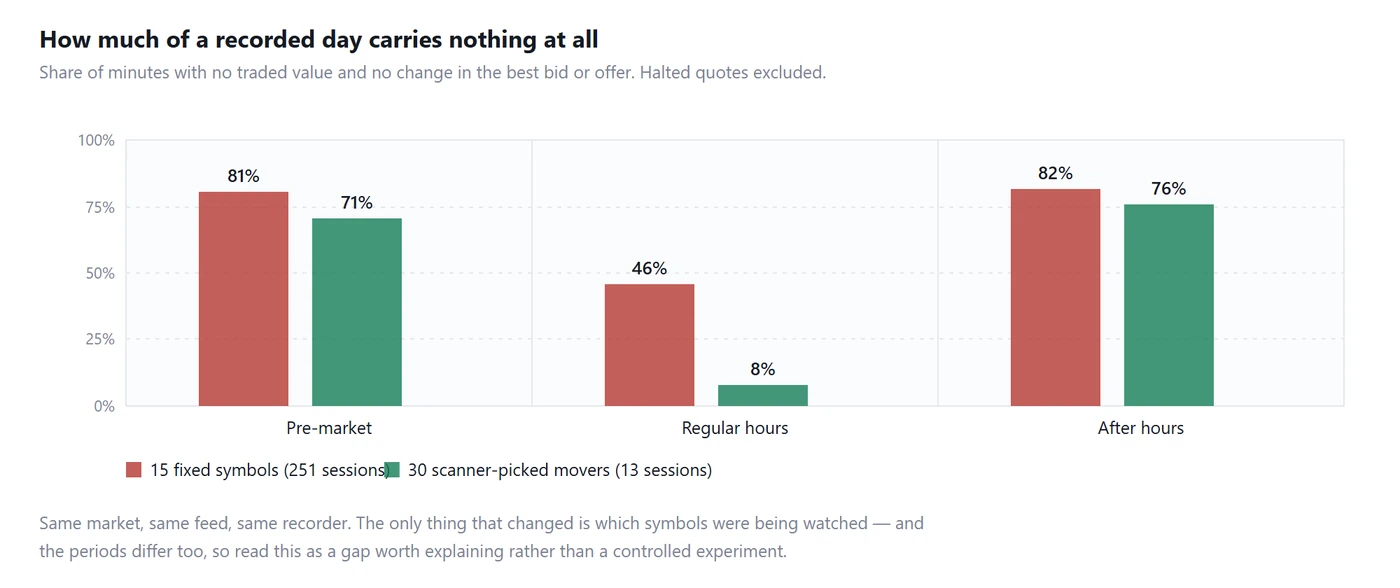
Share of minutes with no trade and no quote change, by session segment and watchlist type
Session segment
15 fixed symbols
30 scanner-picked movers
Pre-market
81%
71%
Regular hours
46%
8%
After hours
82%
76%
The regular-hours row is the one to sit with. With a fixed watchlist, 46% of regular trading hours produced no new information at all. With a scanner picking the day's movers, the same measurement gives 8%.
That is close to a six-fold difference in how much of a recording is worth anything, and it comes from the choice of what to watch rather than from the market, the broker or the recorder, all of which were the same.
An honest caveat belongs immediately next to that number. The two setups also ran in different periods: the fixed watchlist covers 251 sessions from April 2025 to March 2026, the scanner covers 13 sessions in July 2026. This is not a controlled experiment. It is a gap large enough that market conditions alone are an implausible explanation, but we cannot separate the two effects with the data we have.
3. Quiet is not the same as silent
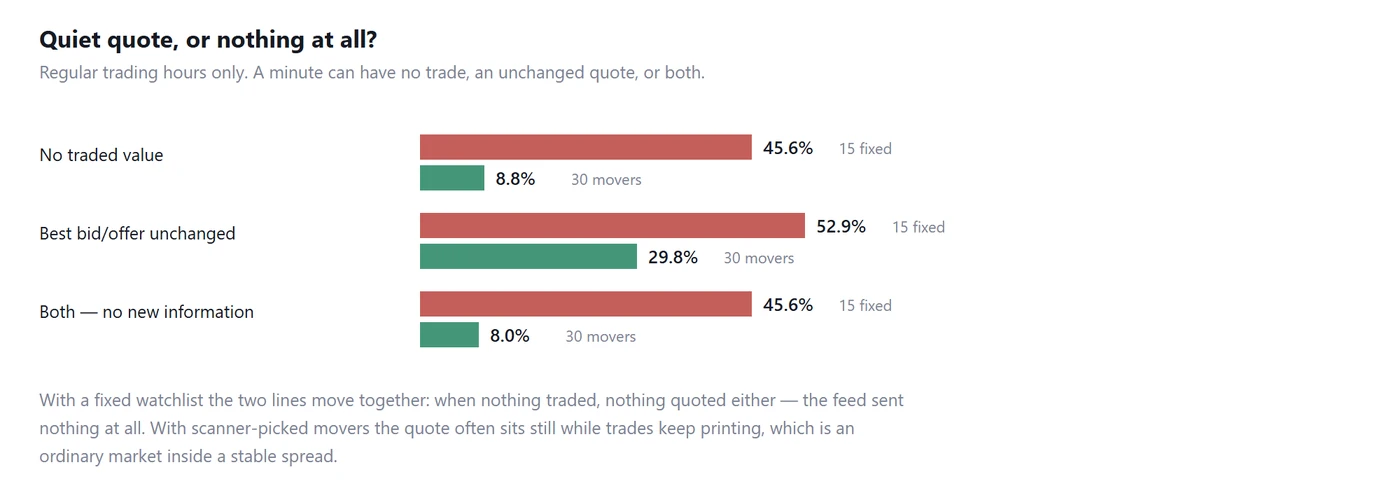
Breakdown of regular hours into no-trade minutes, unchanged-quote minutes, and both
Splitting the regular-hours number into its two parts is where the mechanism shows up.
Regular hours
15 fixed symbols
30 scanner-picked movers
No traded value
45.6%
8.8%
Best bid or offer unchanged
52.9%
29.8%
Both — no new information
45.6%
8.0%
With the fixed watchlist the no-trade share and the dead share are the same number, to one decimal place. Every minute without a trade was also a minute without a quote change. That is the signature of a feed sending nothing at all for that symbol, rather than of a market standing still.
With the movers the two numbers separate. Nearly a third of minutes have an unchanged best bid and offer, but only 8.8% have no trade. That is an ordinary, healthy market: trades printing steadily inside a spread that happens to be stable for a minute.
So the same headline statistic covers two completely different situations. One of them is a quiet market you can reason about. The other is an absence of data that merely looks like a quiet market.
4. Stalls are long
Dead minutes cluster rather than scatter.
Session segment
Stalls of 5+ minutes
Median length
Longest
Pre-market
19,498
12 min
329 min
Regular hours
34,982
8 min
359 min
After hours
22,720
12 min
398 min
The longest single regular-hours stall ran 359 minutes. Most of a session — on a symbol that was in the universe the entire time. A scanner evaluating that name every minute evaluated it hundreds of times against numbers that never changed.
Outside regular hours the picture is worse and less surprising. Pre-market and after-hours are 71% to 82% dead under either setup. If you are testing an extended-hours strategy, most of the file you are testing on is not a market.
5. What a stall does to a strategy
The problem is rarely that a rule fires on a stale price. It is that everything derived from the stall is wrong in a way that looks correct.
Averages absorb it invisibly. A sixty-minute moving average where twenty minutes never updated is not a sixty-minute average. It is a forty-minute average with extra weight on whichever value happened to be sitting there, and it reports no error.
Volatility filters invert. A window that contains a stall looks calm, because a repeated value has no variance. A regime filter reading that window concludes conditions are quiet and lets entries through — in a name whose data has stopped arriving.
Turnover conditions become time-of-day filters. A cumulative measure such as traded value stops growing during a stall. A rule comparing against it behaves differently before and after, for reasons that have nothing to do with the rule.
Backtests look better than live. Every one of these effects flatters a backtest, because the strategy is being scored on a market that appeared calmer and cleaner than the one it will actually trade.
6. What to do about it
Check your data before your strategy. If a symbol produces unusually good results, look at its price history before looking at your rules. A flat stretch is easier to see than to detect.
Prefer relative measures over cumulative ones. A per-second or per-minute quantity goes to zero during a stall, which is visible. A cumulative quantity simply stops, which is not.
Watch things that are moving. This sounds circular, and it is also the single largest effect we measured. A scanner that keeps the universe on the day's active names produced data that was six times more informative per minute than a fixed list did.
Gate on liquidity in the strategy itself. A minimum traded-value condition keeps a rule out of names where a stall is likely, and costs one line.
7. Method and limits
Every minute in this study satisfies four conditions: the symbol was in the recorded universe, the recording was running, the quote was not crossed, and the symbol traded at least once that day. Dead means no increase in cumulative traded value and no change in the best bid or offer, including minutes where no data arrived at all. A stall is five or more consecutive dead minutes. Sessions run 2025-04-02 to 2026-07-31 and the measurement covers 3.13 million qualifying symbol-minutes.
The halt filter is a proxy. We do not receive a halt flag, so we exclude minutes where the bid is above the ask. That catches the clearest cases and misses halts where the quote stays uncrossed. Only 4,259 minutes were excluded this way, so halts are not doing much work in these numbers either way.
The two setups are not a controlled comparison. Different watchlists and different periods, as described in section 2.
This describes our recordings, not the market. A dead minute means our feed delivered nothing new for that symbol. Whether the market was genuinely still or the data simply did not reach us is a distinction this measurement cannot always make, and we have been careful above not to claim it can.
One broker. Another vendor's delivery behaviour on quiet symbols could differ substantially.
The US stock backtest walkthrough covers the recording side of this, and our measurement of what a round trip costs uses the same archive. The crypto equivalent of this study is here.
Originally published by TraderWe on August 16, 2026. You may quote and link to this page. Republishing the full text without a link back to the original is not permitted.
ok so dumb question but if most of those minutes are just yesterday's info with a new timestamp, does that mean my backtest sample size is basically fake? like I thought I had tons of bars to train on and now I'm not sure what I actually have. also confused about the crossed quote thing - are those minutes just thrown out or treated as dead?
the halt detail is the part I keep chewing on, in perps I never think about it but the idea that a stall can run for most of a session on a fixed list is more than I assumed. gonna check if my equity watchlist is just 15 names sitting still while I congratulate myself on staying disciplined.
Fair method but no change in best bid or offer is a coarse filter - size at the touch can churn hard while the top of book prints identical. A minute with no trades is still a minute where your resting order ages and your spread cost assumption drifts, so I'd hesitate to call it informationless from an execution standpoint. Would want to see the same count split by tick size regime before I change anything.