By TraderWe· Published Aug 16, 2026· Updated Aug 17, 2026· 💬 3
Study details
Measured
2025-04-02 – 2026-07-31, 264 recorded sessions; 1,034,768 regular-hours minute rows
Instruments
US equities, intraday movers; last trade price against the quoted book
Method
flag rows where the last price sits outside the bid-ask, first with a flat percentage tolerance and then with a tolerance scaled to each symbol's own spread, then classify what was left by whether the symbol was trading at the time
Result
the flat rule flagged 1.90% of rows. Scaling the tolerance to the spread left 0.22%, and 68.9% of those were symbols that had not traded that day at all. What remained was 0.05% of rows, with ordinary explanations available for those too
We went looking for a bug in our own market data and did not find one. What we found instead was a good lesson in how to tell a broken feed from a market doing something unusual, and we are writing it down because the wrong version of this test is easy to write and produces an alarming number.
The short version: a naive check said 1.90% of our recorded quotes were broken. A correct check said 0.05%, and even those have ordinary explanations. The difference was entirely in how the test was written.
1. The thing that looks wrong
Every market data feed gives you a last traded price and a quote — the best bid and the best offer. Most of the time the last price sits between them, and it feels like it should always be there.
It does not have to be. Here is a real row from our archive.
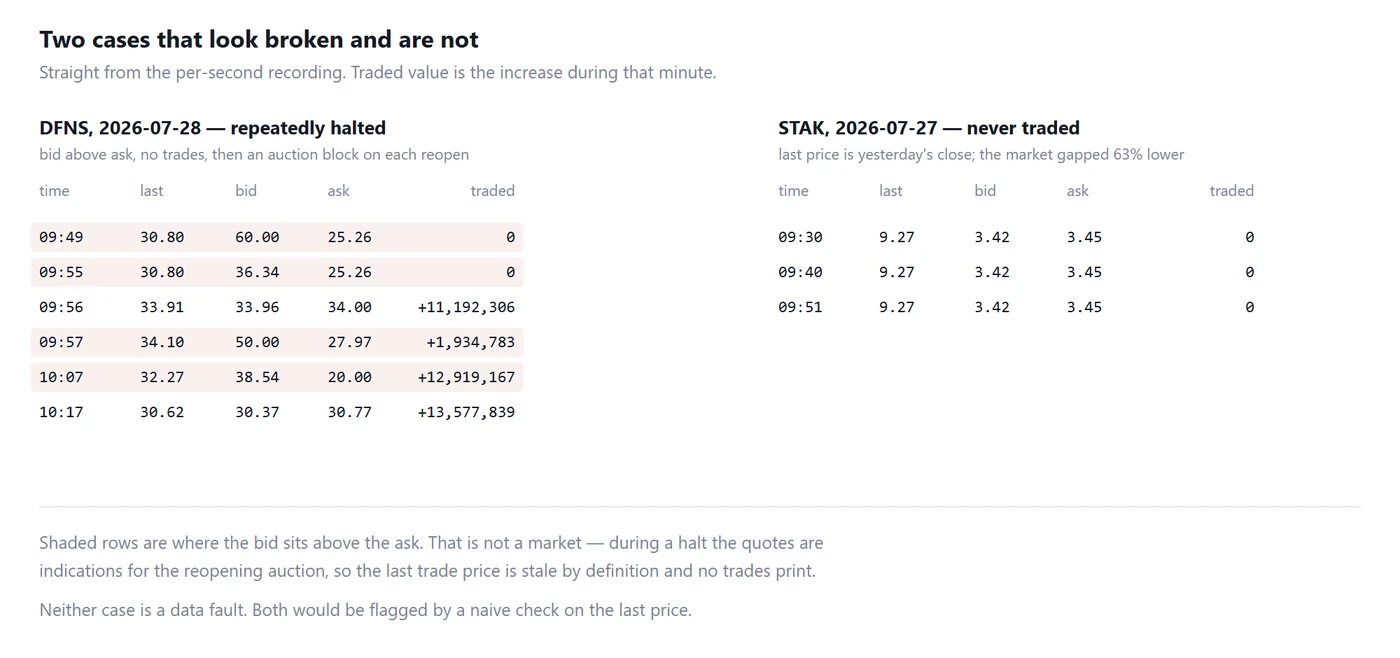
STAK 2026-07-27 09:30 last 9.27 bid 3.42 ask 3.45
The last trade says $9.27. The market says you can sell at $3.42 or buy at $3.45. Those differ by 169%. Something is clearly wrong. And nothing is wrong at all, which is the point of this article.
2. Writing the test badly
Our first test was one line: flag any row where the last price is more than 0.5% outside the quoted bid-ask.
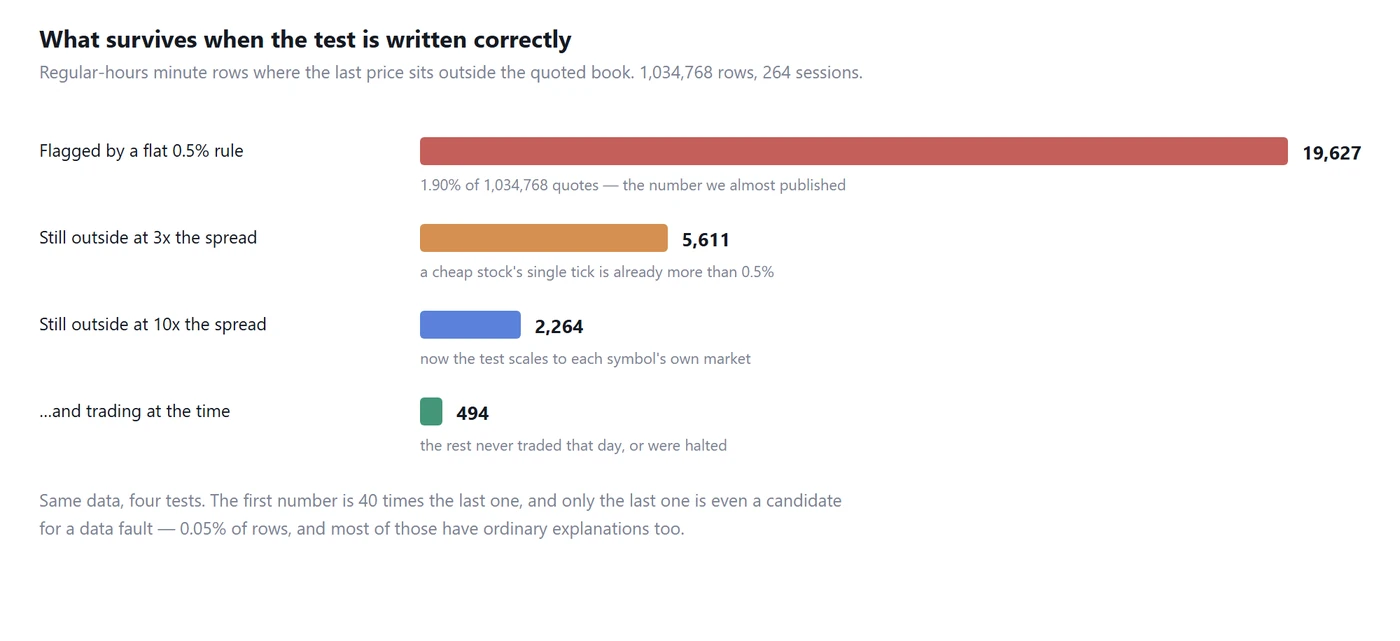
Across 264 recorded sessions and 1,034,768 regular-hours minute rows, that flagged 19,627 rows, or 1.90%, present in every month of the archive at between 1.18% and 2.54%. That looks like a systematic fault. We were an hour away from calling it one.
The mistake is the flat 0.5%. Look at what it actually catches:
GNPX   last 0.3176   bid 0.3080   ask 0.3150     traded $4,731 that minute
XHLD   last 0.9068   bid 0.8777   ask 0.9012     traded $45 that minute
The last price is 0.6% to 0.8% away from the offer. On a $0.30 stock, one cent is over 3%. The tolerance is smaller than the market's own minimum price increment, so the test is guaranteed to fire on cheap names no matter how healthy the data is.
There is also a conceptual error underneath the numerical one. The last price is a past event and the quote is the present. A trade printed at 11:14:30 and a book sampled at 11:14:59 are not describing the same instant. On a thin stock that moves one percent in seconds, a gap between them is the normal state of affairs, not a fault.
3. Writing it correctly
The fix is to scale the tolerance to each symbol's own market: flag a row only when the last price is outside the book by more than some multiple of the current spread. A tick-wide market gets a tick-sized tolerance, a wide market gets a wide one, and the test means the same thing everywhere.
How the count of flagged rows collapses as the test is corrected
Test
Rows flagged
Share
Flat 0.5% tolerance
19,627
1.90%
Outside 3x the spread
5,611
0.54%
Outside 10x the spread
2,264
0.22%
…and trading at the time
494
0.05%
Each step is the same data with a better question. The last row is the only one that could be evidence of a fault, and it is one row in two thousand.
4. What the survivors actually are
Take the 2,264 rows that are still more than ten spreads outside the book and ask a single question: was the symbol trading at that moment?
Category
Rows
Share
Had not traded at all that day
1,560
68.9%
No trade during that minute
210
9.3%
Trading, and still outside
494
21.8%
Two thirds never traded that day. This is the STAK case from the top of the article. If a stock has not printed a trade today, its "last price" is yesterday's close. The market meanwhile has repriced. STAK's book was 63% below the previous close, and the stock simply had not traded there yet. The feed is telling the exact truth: the last trade was at $9.27, and the current market is $3.45. Anyone reading the last price as a tradable price is misreading the field, not receiving bad data.
The 9.3% are minutes with no trade at all, mostly around halts. Which brings us to the case that fooled us hardest.
5. The halt
Second-by-second replay of two cases that look like broken data
DFNS on 2026-07-28 showed a last price of $34.10 against a best offer of $27.97 — the last trade eighteen percent above the price you could buy at. We were confident this was a frozen price field.
The per-second replay says otherwise. From 09:45 to 10:17 the bid sits above the ask: bid 60.00 against ask 25.26, bid 40.94 against ask 20.00. A crossed quote is not a market. During a trading halt the quotes become indications for the reopening auction rather than executable prices, and they cross freely.
The traded value confirms it. Nothing trades for minutes at a time, and then a single enormous print appears — $11.2M, then $1.9M, then $12.9M, then $13.6M. Which is the reopening auction clearing. After 10:17 the book uncrosses to a normal 30.37 by 30.77 and trades resume every minute.
DFNS was halted and reopened repeatedly through the first hour. Everything our data showed was correct.
Halts are not rare in this population. Across the archive, 10.9% of symbol-days contain at least one crossed quote, and 224 of 264 sessions have at least one. Most are brief — the median crossed run is one minute. But 242 ran five minutes or longer and the longest covered 374 minutes.
6. What is left, and why we are not calling it a bug
That leaves 494 rows out of 1,034,768 where a symbol was actively trading and the last price still sat more than ten spreads outside the book. That is 0.05%, and even here there are ordinary explanations we cannot rule out: a block printing away from the quoted market, a trade reported with a delay, or the book moving hard in the moment after a print.
We have no evidence of a data fault. We are stating that plainly because the interesting result here was a negative one, and negative results only help if somebody publishes them.
7. What to do with this
Do not build strategy logic on the last price when you mean a tradable price. If you want to know what you can buy at, read the offer. If you want to know what you can sell at, read the bid. The last price answers a different question. What somebody else paid, at some earlier moment.
Do not compare prices with a flat percentage. Any threshold that ignores the minimum tick will fire constantly on low-priced names. Scale it to the spread, and the same rule works across the price range. This applies to your strategy conditions as much as to your data checks.
Exclude crossed quotes before measuring anything. A crossed book usually means a halt. Leaving those rows in contaminates every statistic you compute — we exclude them from our cost and depth measurements for exactly this reason.
Rule out the market before blaming the data. Halts, symbols that have not traded, corporate actions and away prints explain nearly everything that looks broken in an equity feed. Check those four first. The replay of a single symbol's raw ticks settles most questions in five minutes, and it settled this one.
8. Method and limits
Every row here is a one-minute record from our own recordings, restricted to regular trading hours, where both sides of the quote are populated. Outside means the last price is above the ask or below the bid by more than the stated tolerance — first a flat 0.5%, then a multiple of the current spread. The classification in section 4 uses cumulative traded value: zero for the day means the symbol never traded, no increase during the minute means it did not trade then.
A crossed quote is a proxy for a halt, not a halt flag. Our feed does not carry halt status, so we infer it. That catches the clear cases and misses halts where the quote stays uncrossed.
We cannot prove the last 0.05% is fine. We can only say the explanations available are ordinary ones and we found no pattern suggesting otherwise. Absence of evidence is what we have, and it is worth less than evidence of absence.
One broker's feed, one population. Active intraday movers, which are exactly the names where halts and non-trading are common. A mega-cap feed would show almost none of this.
The factor reference documents which price and book fields a strategy can read, and the US stock backtest walkthrough covers recording the data this was measured on.
Originally published by TraderWe on August 16, 2026. You may quote and link to this page. Republishing the full text without a link back to the original is not permitted.
So the bug was in the test, not the feed. Shocking. Half the 'anomalies' people post here are just someone comparing a stale last trade to a live quote and calling it a conspiracy.
There's something calming about this one - the first number looked scary and the honest response was to check the ruler before checking the market. I catch myself doing the opposite when a position moves against me.
Good writeup, and the part I'll actually use is scaling the tolerance to each symbol's own spread instead of one flat number for everything. I trade a mix of very liquid names and some thinner movers on the 5m, and a rule that fits the liquid ones flags the thin ones constantly. One thing I'd like spelled out more: how they handled the first and last few minutes of the session, since that's where my entries cluster and where last-vs-quote gaps feel worst to me. Also curious whether the leftovers were concentrated in a handful of symbols or spread evenly.