Do chart patterns work? 2,777,576 signals measured
By TraderWe· Published Sep 27, 2026· Updated Sep 27, 2026· 💬 0
Study details
Measured
2025-08-25 - 2026-08-21, 250 signal days, after a 20-day screen run on 2026-07-27 - 2026-08-21
Instruments
US stocks closing at or above $3 with a 20-day median turnover of at least $5,000,000, delisted names kept in
Method
run each detector on bars up to the signal day only, enter at the next open, exit at the close 1, 5, 10 and 20 sessions later, and measure the excess over the same-day average of the whole qualifying universe. Screen on 20 days first, then retest every promoted signal on a full year with the half-and-half split fixed in advance
Result
17 signals cleared the 20-day screen and 0 of 86 cleared the year. Across 344 signal-by-horizon cells, 7 beat a 20bp round trip, and readings that reached significance ran against the textbook 18 times to 8
Chart patterns, Elliott wave and Fibonacci retracements are the three things a new trader is taught
to see, and all three are testable. Not as vibes, as detectors: a program reads the bars, marks the
setup, and you go and look at what happened next.
So we ran ours over 2,777,576 events on US stocks and wrote down the answer before looking.
1. What was tested, and how
Three detectors, 86 signals in total. Thirty classic chart patterns. Fourteen Elliott wave states,
run three different ways, using the same automatic wave counter that draws the chart in our own
application. Fourteen Fibonacci retracement bands, fired on the session a price first enters the
band.
Every detector sees bars up to the signal day and nothing after it. Entry is the next open, which is
the first price you could actually pay. Exit is the close 1, 5, 10 or 20 sessions later.
The comparison matters more than the entry. A signal is not judged against zero, it is judged
against the same-day average of every stock that qualified that day, which is what a coin flip
picking the same number of names would have returned. Bearish signals have their sign flipped, so a
positive number always means the pattern was right.
2. The 20-day screen said yes
We screened on 20 trading days first, 232,164 events, because a short window is cheap and a signal
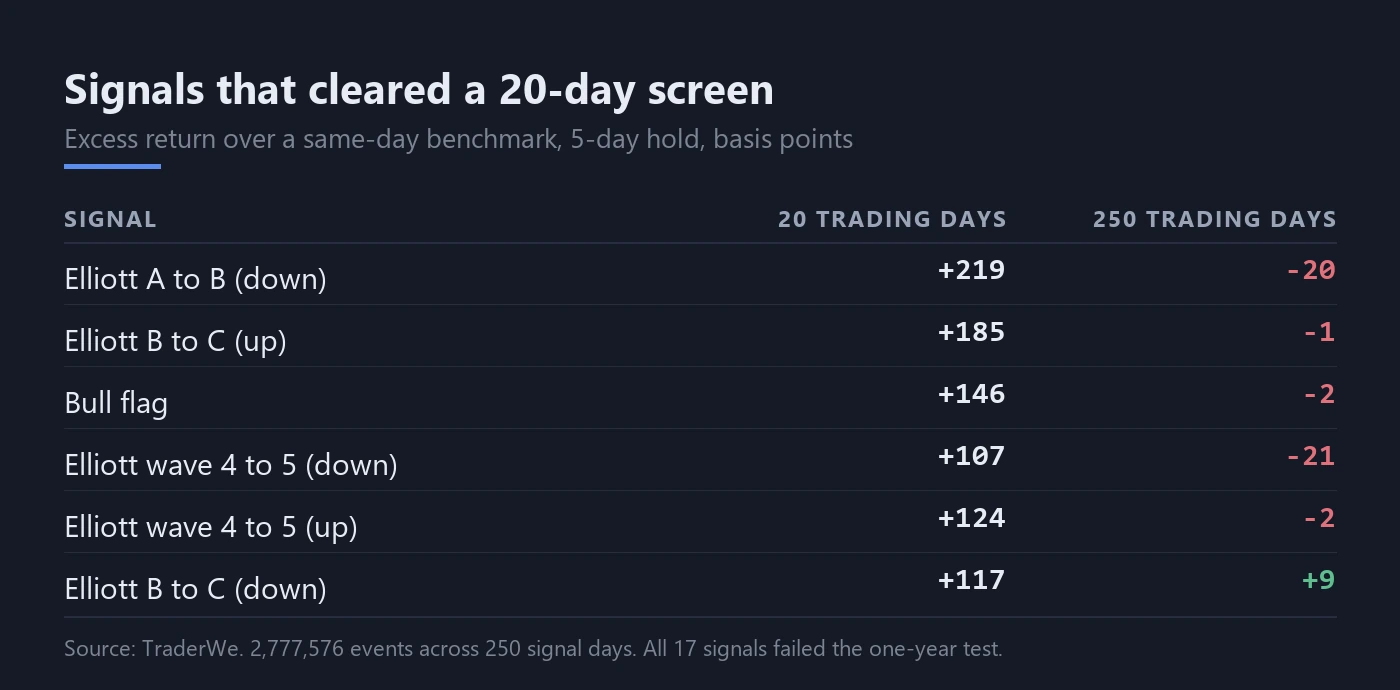
that cannot survive one is not worth a year of compute. Seventeen signals cleared it.
They cleared it convincingly. A bull flag came in at plus 146 basis points over the benchmark on a
5-day hold. Two Elliott states came in higher still, at plus 185 and plus 219.
The right-hand column is the same signal, the same detector and the same 5-day hold, measured on 250
trading days instead of 20. The bull flag goes from plus 146 to minus 2. Nothing in that column is
worth a commission.
3. The year said no, at every holding period
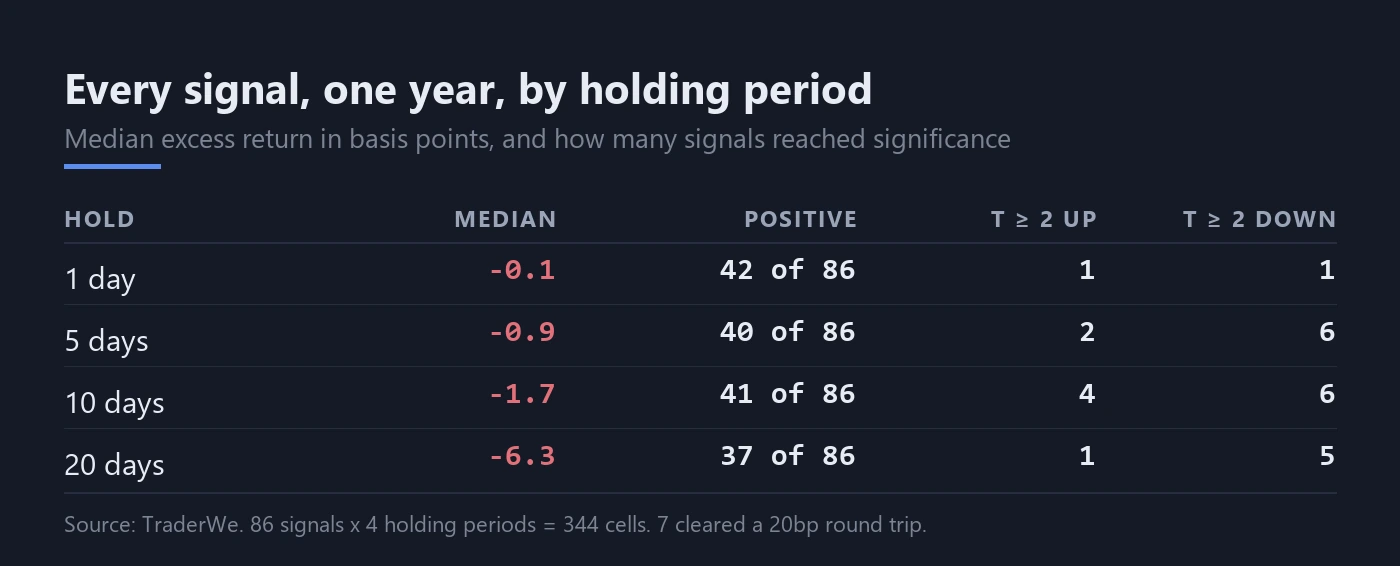
All 17 failed. So did the other 69, which is the part that matters: 0 of 86 signals passed.
The median signal is slightly negative at every horizon, and gets worse the longer you hold. Roughly
half the signals are positive and half negative at each horizon, which is what you would expect from
labels sprinkled at random.
Significance does not rescue it either. Across 344 cells, 26 reached a t-statistic of 2 or more in
absolute value. Chance alone would put roughly 17 there, so there is a little more structure than
noise, and it points the wrong way: 18 of the 26 are negative. The patterns are not predicting
nothing so much as occasionally predicting the opposite.
4. What did survive, and why it still does not help
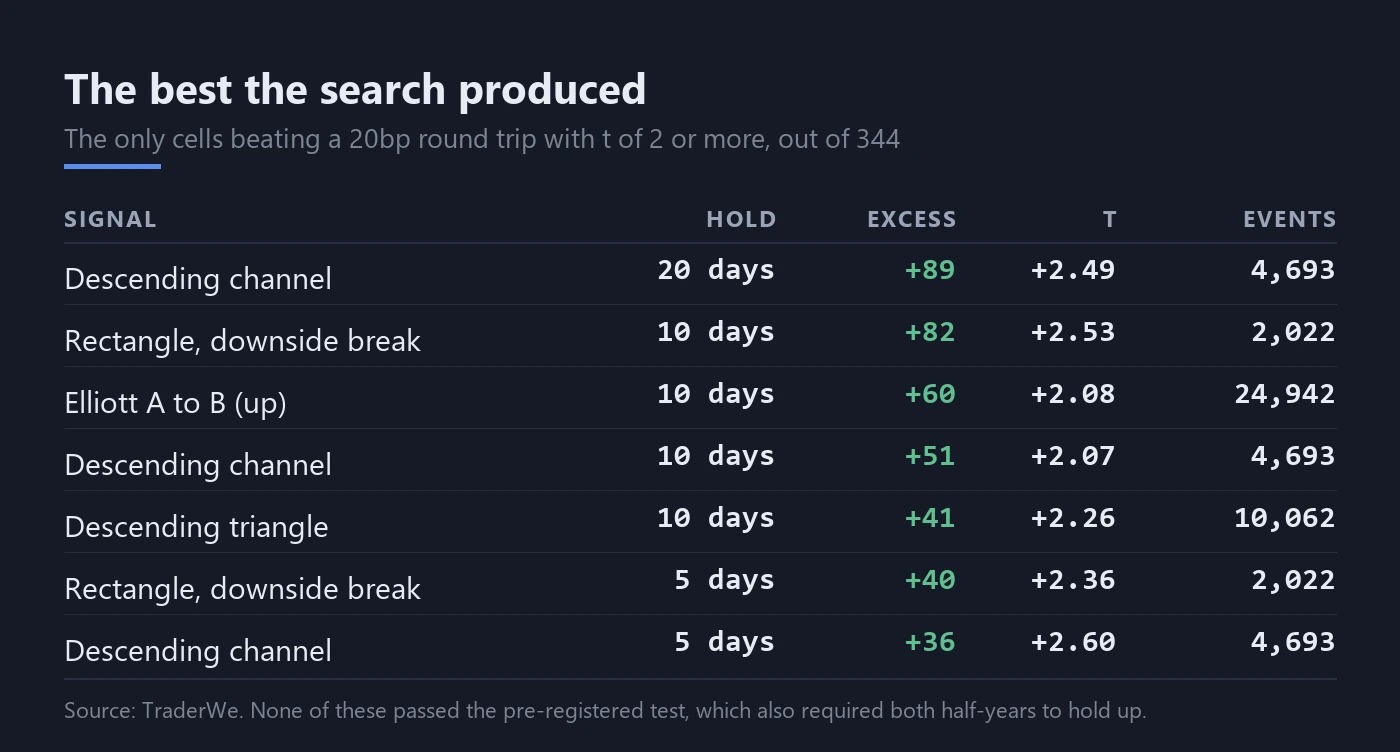
Seven of the 344 cells beat a 20bp round trip with a t-statistic of at least 2. Here they are in
full, because a study that shows only its failures is not showing you its evidence.
Two things about that table. Seven cells out of 344 is close to what multiple testing hands you for
free, and none of the seven passed the pre-registered test, which also required each half of the
year to hold up on its own.
Then the composition. Six of the seven are bearish setups that worked as bearish setups: descending
channels, a descending triangle, a rectangle breaking down. To collect them you would have to be
short, on individual US stocks, in size, repeatedly. Whether you can borrow those names, and whether
a short sale restriction is live that day, are separate problems and not small ones.
The exception is an Elliott state on the long side, plus 60 basis points over a 10-day hold on
24,942 events. That is a real number. It is also one cell out of 344, found by a search that ran 86
signals at four horizons, and it did not clear the pre-registered bar.
What is not in that table is any bullish chart pattern anybody teaches.
5. On shorter horizons, the benchmark decides the answer
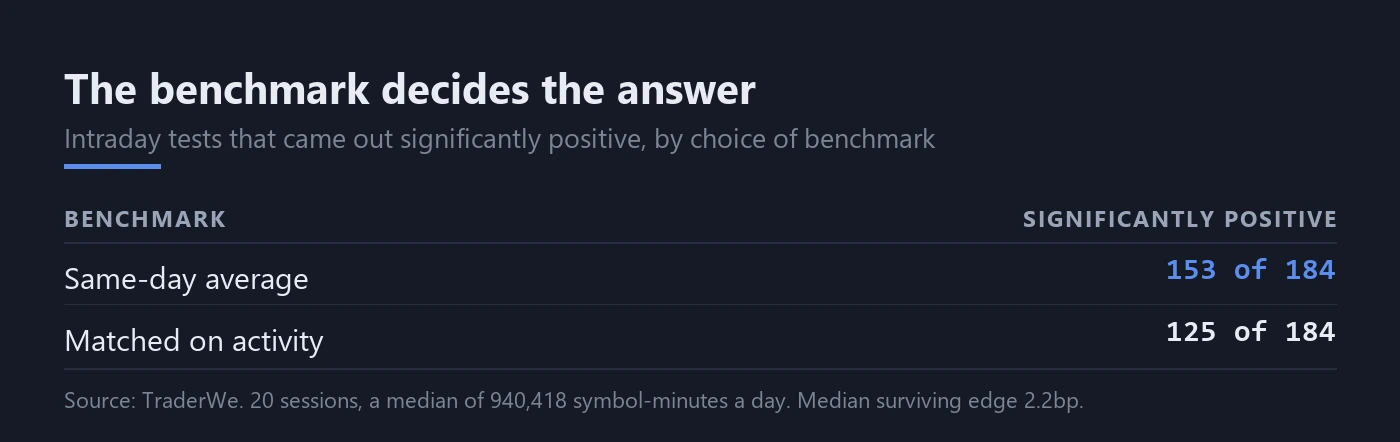
The obvious objection is that daily bars are too slow, so we ran the same detectors intraday over 20
sessions, a median of 940,418 symbol-minutes a day across 3,582 symbols, 184 tests in all.
Measured against the plain same-day average, 153 of those 184 tests come out significantly positive.
That number is a trap, and it is worth understanding why, because it is the single easiest way to
convince yourself a pattern works.
A pattern only fires on a bar that is doing something. Comparing those minutes against the average
minute of the day is comparing moving stocks against still ones, so the pattern wins before it has
predicted anything. Match each event to minutes with the same recent range and the same position in
the day's move and the count falls, and more importantly the size collapses: the median surviving
edge is 2.2 basis points, the mean 6.5, against a round trip that costs about 20.
They stay statistically significant and become economically irrelevant. With two million events you
can measure two basis points very precisely. You still cannot trade it.
6. What we did not open
The design set aside an earlier stretch of history as a sealed holdout, to be measured only if
something passed the year. Nothing passed, so the seal is intact and this article is not a
post-hoc search through it.
That is deliberate. The most common way this kind of study lies is that the author keeps testing
windows until one agrees, then writes up that window.
What this does not say
It does not say these shapes are absent from charts. The detectors found millions of them. It says
that on this universe, entering at the next open and exiting on a fixed schedule, they did not
predict direction well enough to pay for the trade.
It does not test discretionary use. A person reading a chart applies context we did not encode, and
this measurement cannot speak to that either way.
It does not cover every parameterisation. Our patterns use a fixed pivot width and our wave counter
uses its own thresholds; another implementation would produce different events. That is a real
limitation and also the reason the result is worth publishing rather than assuming.
Limitations
Nothing was excluded for being ugly, but unadjusted split artefacts were: any event whose lookback or
forward window contained a one-day move of 45% or more against the prior close was dropped, because
the price history is unadjusted and a split looks exactly like a signal.
The universe includes exchange-traded funds, which we cannot separate in this data, and it requires
a $3 close and a 20-day median turnover of $5,000,000. Cheaper and thinner names are outside it, and
those are where a lot of pattern trading actually happens.
Fixed-schedule exits are a diagnostic, not a strategy. They measure whether direction is there. They
do not test a rule that gets out early on a stop or late on a trend, and a very patient or very
impatient exit could change the picture.
The window is one year of signal days plus a 20-day screen, on one market, in one regime.
Originally published by TraderWe on September 27, 2026. You may quote and link to this page. Republishing the full text without a link back to the original is not permitted.