Does the opening range breakout work? 4 markets, 16 years
By TraderWe· Published Oct 4, 2026· Updated Oct 4, 2026· 💬 0
Study details
Measured
2010 - 2026 one-minute bars on four markets, split into 2010-2017, 2018-2021 and 2022-2026
Instruments
Nasdaq futures, gold, DAX and FTSE. Gold, DAX and FTSE are free spot and CFD proxies rather than the futures themselves
Method
for every 30-minute slot of the day, take the high and low of the first 15 minutes, enter on the first one-minute close beyond it, stop at the range width and target twice that. Then take the same trade in the opposite direction and halve the difference. Costs appear identically in both, so they cancel and what is left is the direction information alone
Result
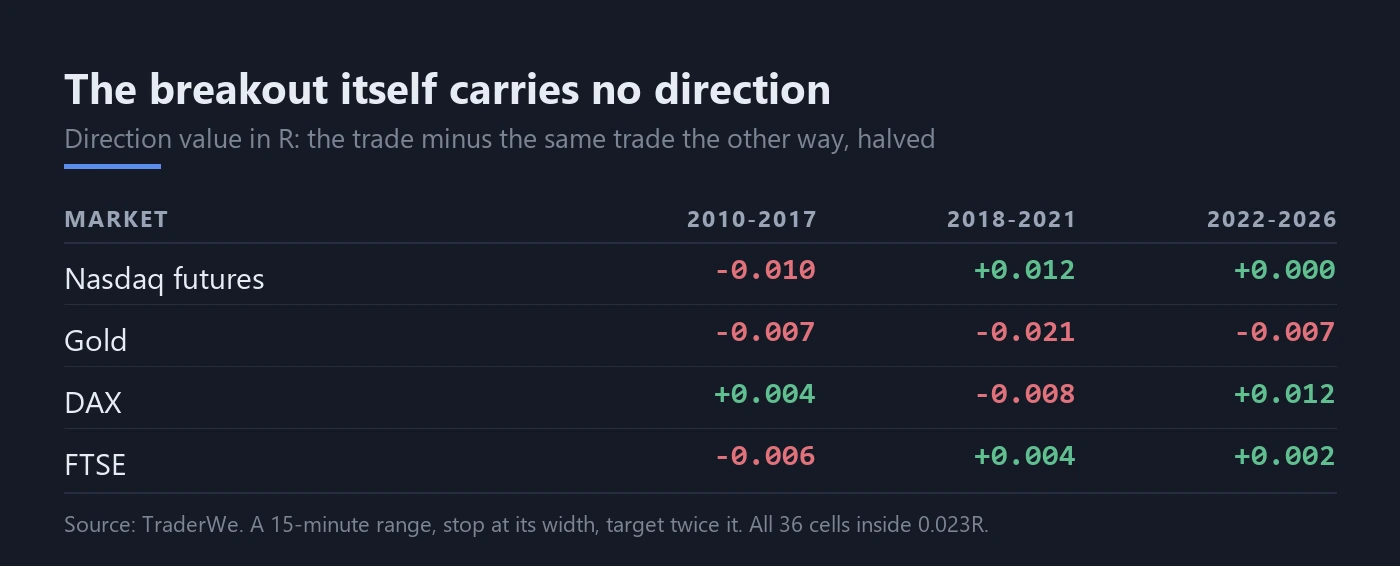
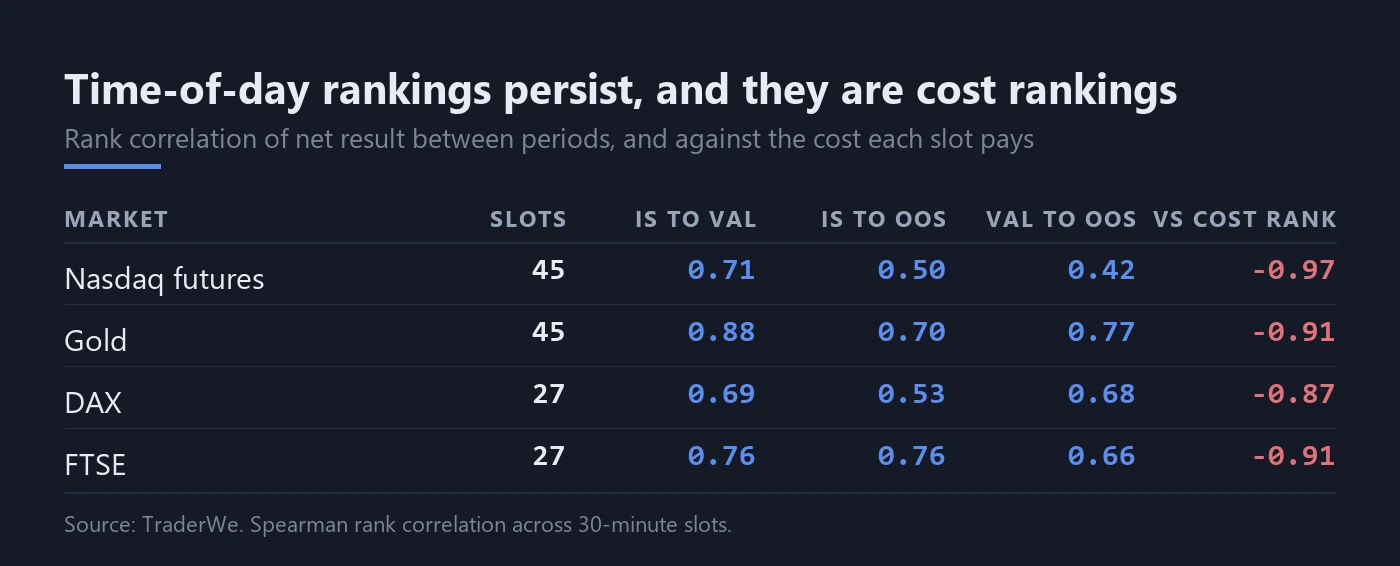
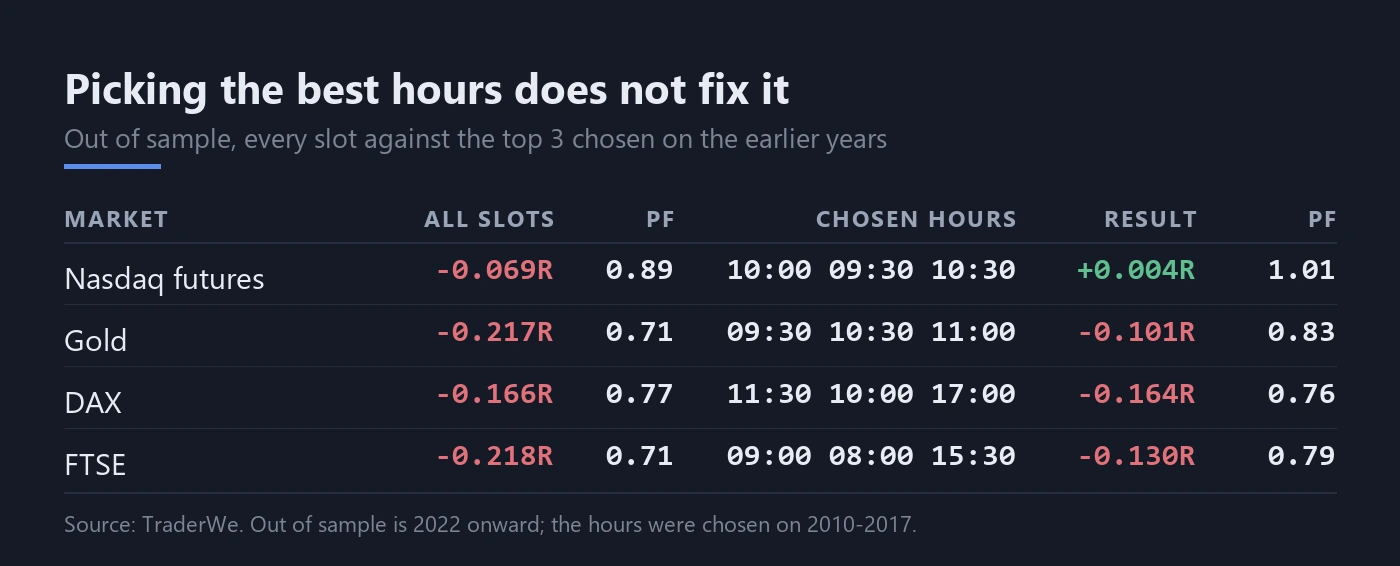
the direction value is inside 0.023R in all 36 cells. Slot rankings do persist, with rank correlations of 0.42 to 0.88, but those rankings correlate 0.87 to 0.97 negatively with the cost each slot pays. Choosing the best hours on the earlier years left the best of the four at 0.004R and the other three clearly negative
Opening range breakout is the first mechanical strategy most futures traders meet, and it comes with
a second claim attached: that each instrument has its own hours, and trading only those hours is
where the money is.
Both halves are testable on free data. We tested them on four markets and sixteen years, and wrote
down what would count as a pass before looking.
1. The tool that makes this cheap to answer
The usual way to ask whether a signal works is to compare it against random entries, which means
running hundreds of simulations and arguing about cost assumptions afterwards.
There is a shortcut. Take the breakout trade, then take the identical trade with the direction
flipped, same moment, same stop distance, same target. Subtract and halve. Commissions, slippage and
the spread are in both legs in the same size, so they cancel exactly. What survives is the direction
information and nothing else.
We call that the direction value. If the breakout knows which way price is going, it is positive. If
it does not, it sits at zero no matter how the net result looks.
2. The breakout does not know which way price is going
Four markets, three periods, and the same answer in each. Widening the range to 30 or 60 minutes does
not change it: all 36 cells land inside 0.023R, which is nothing. The best excursion before the stop
and the worst excursion before the target are the same size, which is what a coin flip produces.
That is the first claim gone. Whatever the net result of an opening range strategy is, it is not
coming from the breakout predicting direction.
3. The hours really do rank consistently
Here is where it gets interesting, because the second claim appears to pass.
Rank the slots by net result in the first eight years, then rank them again in the next four, and the
two rankings agree. The correlation runs from 0.42 to 0.88 depending on market and pair of periods,
and it is nowhere near chance. A trader who measured the best hours on history and traded only those
would, in fact, be picking hours that stay better.
The last column is the whole story. Each slot pays a cost, and because results are measured in units
of the stop distance, the same dollar cost is a bigger fraction of R when the opening range is narrow.
The slot ranking correlates with the cost ranking at 0.87 to 0.97 negative.
The hours that look best are the hours with the widest ranges. They are not better at predicting; they
are cheaper to trade as a fraction of what you risk. The persistence is real and it is the
persistence of market structure, not of an edge.
4. So picking the best hours does not rescue it
Choosing the three best slots on 2010 to 2017 and trading only those from 2022 onward does improve
things, exactly as the cost explanation predicts. It does not make them profitable. Nasdaq futures
land at plus 0.004R, which is zero with extra steps. Gold, the DAX and the FTSE stay clearly
negative.
Optimising the stop multiple and reward ratio per slot, the way the published versions of this do,
reduces the loss further and never crosses zero. Walking the selection forward, re-choosing the hours
every year on the previous eight, gives the same picture.
5. One cell did survive, and it is worth looking at
We then went back with a second, narrower question: not every half hour of the day, but the specific
moments when a market opens or an number is released, and entering on a stop at the range edge rather
than waiting for a close beyond it. That is 264 cells.
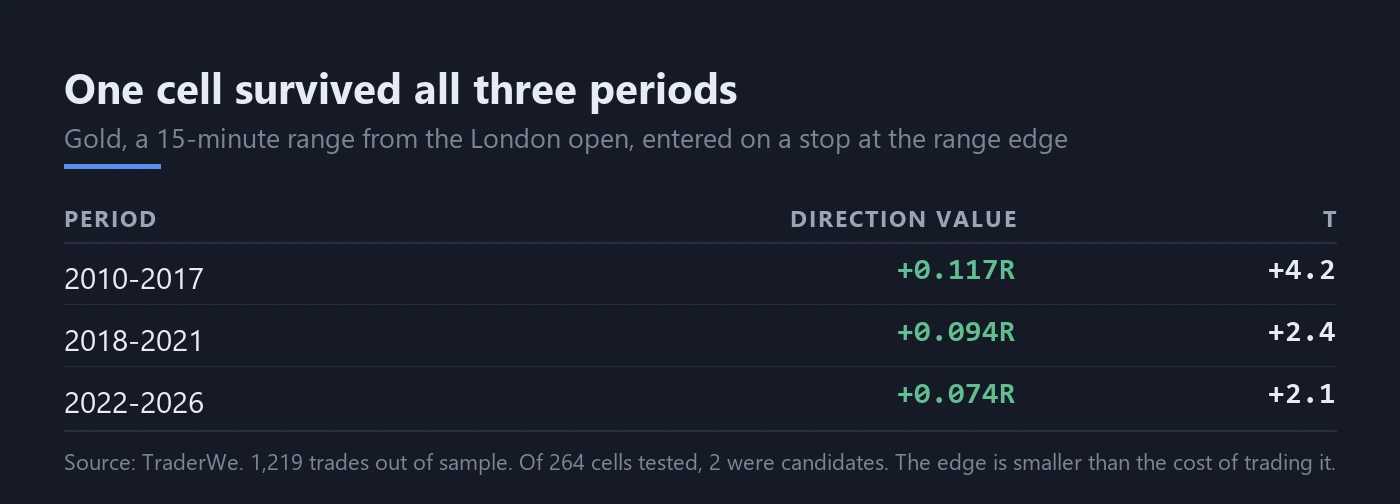
Two of them held up across all three periods, and they are the same setup: gold, the 15-minute range
starting at the London open, entered on a stop.
Three periods, the same sign in each, each one significant on its own, and it works in both
directions rather than only long. Neighbouring half hours are positive too but only this
one holds up in both later periods, which is what you would expect if the London open itself is the
cause.
And it is still not tradable. The 15-minute range at that hour has a median width of $1.87, so the
cost of a round trip is somewhere between 0.10R and 0.25R. The direction value is 0.074R out of
sample. The signal is real and it is smaller than the toll.
That is a more useful outcome than a flat zero, because it shows what the search is actually limited
by. There is a direction effect at the London open in gold. It is simply not big enough relative to
the width of the range it is measured against.
6. What this does and does not settle
It settles that the breakout carries no direction information on these four markets, and that the
time-of-day ranking people fit is a cost artefact. Those two results are robust to range length, stop
multiple and reward ratio, and the first one does not depend on the cost assumption at all.
It does not settle whether some particular published variant is profitable, because the rules that
matter most for a result like that are the filters and exits, and those are usually not published.
What we can say is that if such a version works, the working part is not the breakout and it is not
the hour.
Limitations
Gold, the DAX and the FTSE are free bid-side spot and CFD series, not the futures contracts, and they
carry no volume. Only the Nasdaq series is an actual futures contract. The conclusions that rest on
the direction value hold regardless, since it cancels cost, but the net results in section 4 depend
on cost assumptions we had to make.
The second stage was designed after seeing the first stage, so the gold result carries some search
bias even though its three periods were split in advance. It is reported as an observation, not as a
validated finding.
Entry, stop placement, the 240-minute time exit and the cost figures are our assumptions, not the
rules of any particular published strategy. A different set could produce different net numbers,
though the direction value is insensitive to all of them.
The sample ends in September 2026 and begins in 2010, so it covers one broadly rising regime in
equities and one in gold.
Originally published by TraderWe on October 4, 2026. You may quote and link to this page. Republishing the full text without a link back to the original is not permitted.