Buys when price has dropped far below its own average, on the theory that it snaps back. Works until it doesn't, which is the entire risk of the category.
1. The rule
# BUY
if Price < Sma(300) * 0.985 and DayAmount > 3000000:
    if FallingStreak(20):
        Buy()
# SELL
if ProfitPct >= 1.2 or ProfitPct <= -2.0 or HoldTime >= 1200:
Sell()Note the asymmetry: small target, wider stop. That's the honest shape of mean reversion and it's why win rate looks good and the tail is dangerous.
2. Why the warning belongs in the title
Fading an extended move is the most common way retail accounts are lost, because it feels
correct every single time and is wrong in exactly the situations that matter. The conditions
here are written to be defensible — the price has to be meaningfully below its average and the
name has to trade enough to get out of, but no set of conditions makes counter-trend safe.
FallingStreak(20) is doing more work than it looks like: it requires a sustained fall rather
than one bad tick, which keeps the strategy out of ordinary noise.
3. When it fails
It fails when the extension is the beginning rather than the end. A stock breaking down on
volume looks identical to a stock that has overshot, and this strategy cannot tell them apart.
4. What to change first
Put a regime gate in front of it before you tune anything inside it. Fading works in ranging
conditions and loses in trending ones, so the question that decides this strategy is not the
entry threshold. It is whether you should be trading it today at all.
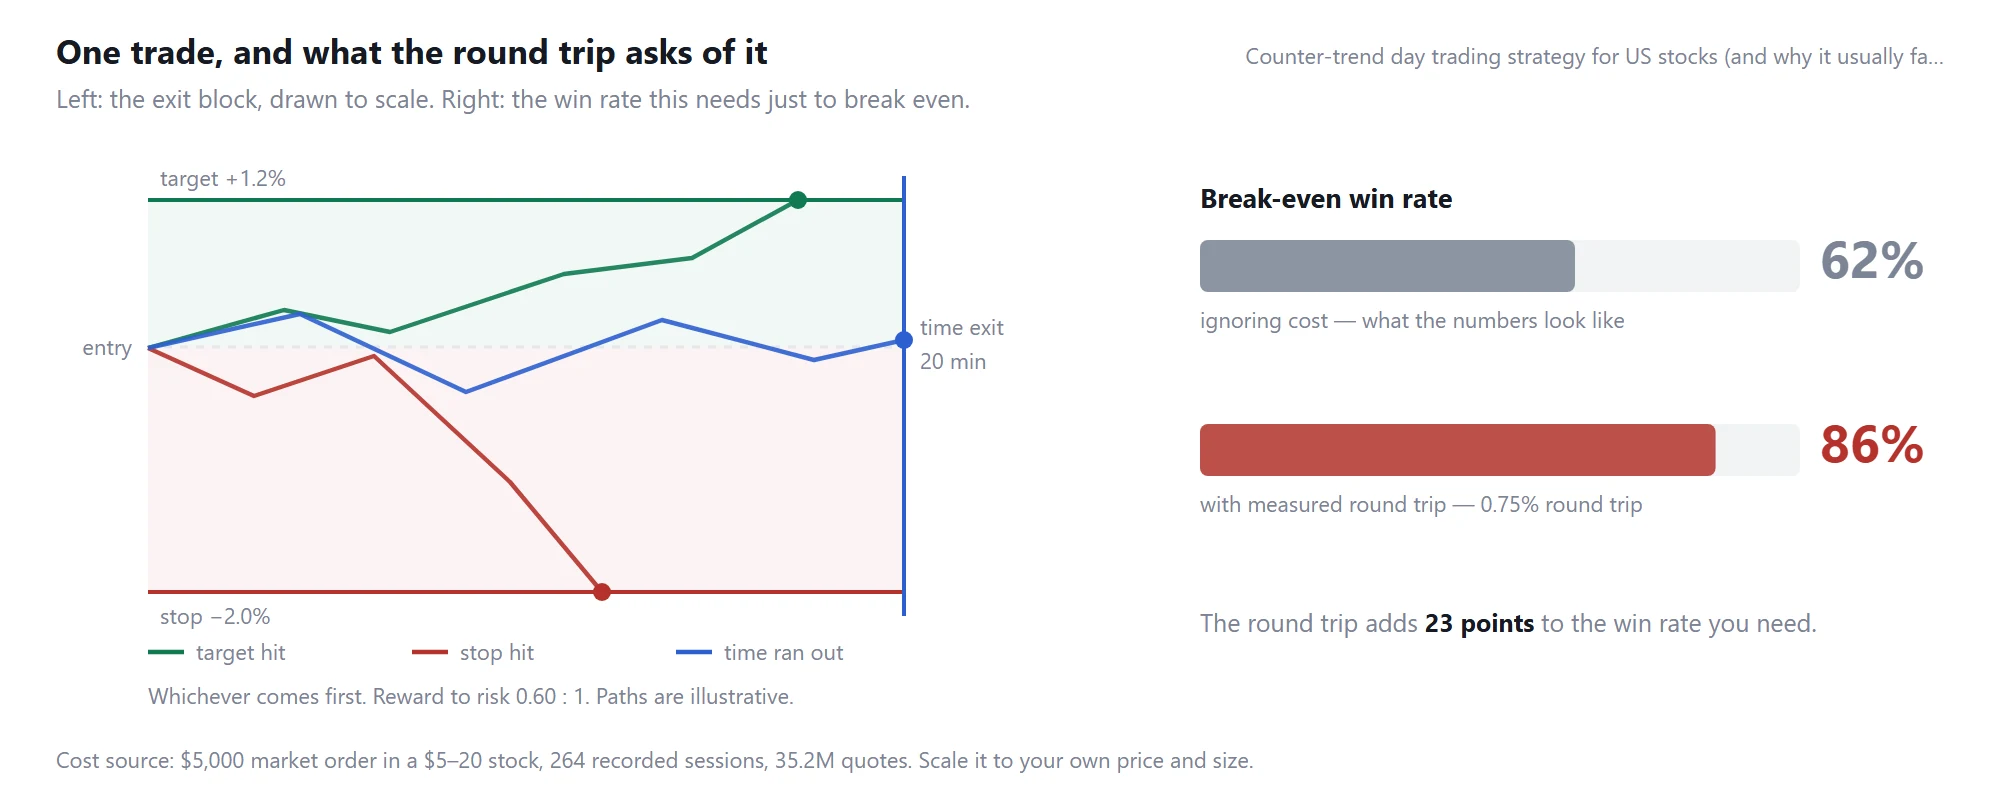
5. What the round trip asks of it
Counter-trend day trading strategy for US stocks (and why it usually fails): the exit block drawn to scale, and the break-even win rate before and after measured trading costs
This is the one strategy in the library where the figure is the point.
The target is 1.2% and the stop is 2.0%, so you are risking more than you stand to make. That needs
a 62% win rate before costs and 86% after. Counter-trend entries do tend to win more often than
they lose, which is exactly why the shape is tempting — but 86% is not a win rate, it is a wish.
We left this strategy in the library on purpose. It is the clearest example of a rule that reads
sensibly, backtests plausibly on a short sample, and cannot survive its own cost structure. If you
want to fade extended moves, the fix is not a better entry: it is a target larger than the stop.
See what day trading a US stock really costs.
Educational template for research and backtesting. Not investment advice and not a signal service.
Originally published by TraderWe on June 15, 2026. You may quote and link to this page. Republishing the full text without a link back to the original is not permitted.
The regime gate is the interesting claim here. How would we actually test it though? Splitting the sample by something like ADX or realised vol and comparing the two buckets seems obvious, but then you've got a threshold you picked after seeing the data. Have you tried defining the gate on one period and only checking it on another?
Three things I'd flag before anyone runs this live:
1. The -2.0 stop and +1.2 target mean you need roughly a 63% win rate just to break even before costs. Worth checking your backtest actually clears that with margin, not by a point or two.
2. The 1200s hold cap is a hidden third exit. In my testing those time exits often carry most of the losses and nobody looks at them separately. Break your results down by exit reason.
3. 0.985, Sma(300), FallingStreak(20), DayAmount 3m, that's four knobs. If you tune all of them on the same data you will find something beautiful and it will not survive.
What strikes me is that this strategy asks you to buy exactly when everything in you says don't. The entry is easy on paper and hard in the chair. Curious how people here sit through the ones that keep falling toward the stop. Do you watch, or do you set it and walk away?
The regime gate point is the one I'd act on. On my 5m charts I'd want a simple daily filter. Is the name inside the last few days' range or has it broken out of it — and only allow the fade in the first case. Doesn't have to be clever, just has to say no on trend days.
Honest question. Could a model learn the difference between overshoot and breakdown, or is that just wishful thinking? Feels like the kind of thing where the features would be the same in both cases and the label only shows up later. Still confused about how you'd even set that up without leaking the future into it.
Fine, the -2.0 is a stop in the sense that a paper umbrella is a roof. On a name in freefall you're not exiting at -2.0, you're exiting somewhere south of it and telling yourself the backtest was close enough. And Betty's right that the time exit is where the bodies are buried — I put it in because holding a broken fade forever is worse, not because 1200 seconds is a number that means anything.