Twenty of you signed up when there was nothing here but a claim and an installer. That is not a
small thing to have done, and we have not forgotten who was first.
So this goes to you before it goes anywhere else, and it goes to you whole, doubts included. Not a
summary, not the flattering half. The full result, the two months we still have in complete detail,
everything we already went looking for, and the one number we do not believe yet.
The rules themselves are sent to founding members directly rather than posted here.
1. What was run
A systematic US equity strategy with no discretion in it anywhere, replayed against our own
one-second recordings from January 2 to July 31, 2026 inside the 09:30 to 11:00 ET window. Positions
are short lived, 6m 7s on average.
It is not the relative volume signal we wrote about earlier. That work showed high relative volume
was good at telling us a stock was about to move and useless at telling us which way. The conditions
here are different ones.
The fill logic is where results like this usually die, so it was built first. An order is only
counted as filled when the tape actually printed at that price. Nothing fills because a bar reached
it.
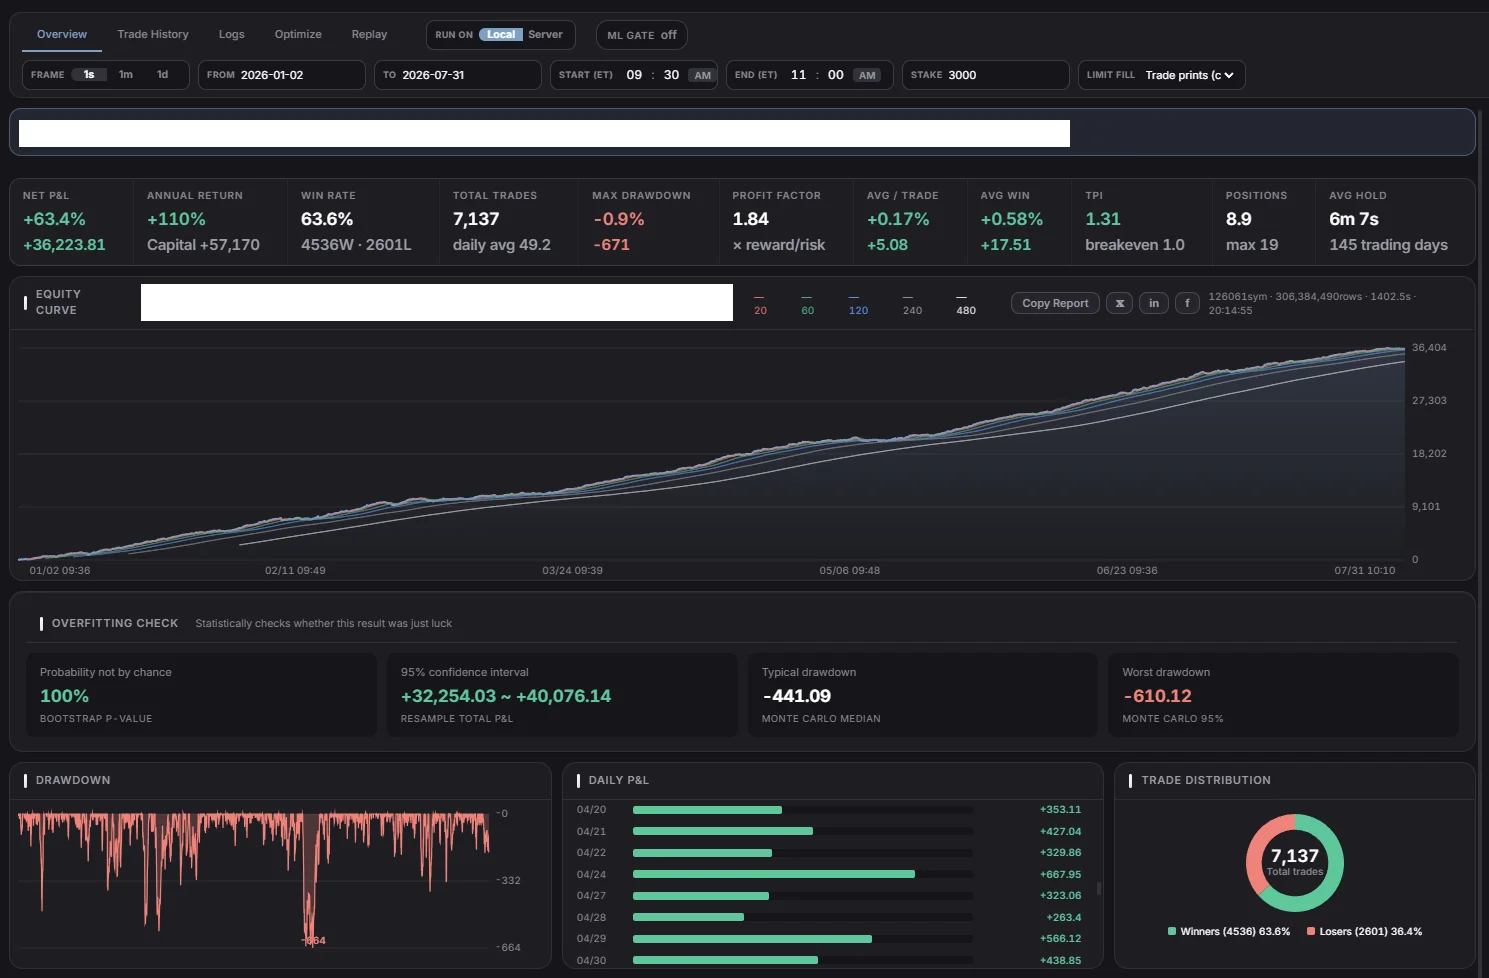
| Full test, January to July 2026 | |
| Trades | 7,137 |
| Win rate | 63.6% |
| Profit factor | 1.84 |
| Average per trade | 0.17% |
| Average hold | 6m 7s |
| Maximum drawdown | 0.9% |
2. Two months in full
We kept per-trade output for June and July. Everything below comes out of those two files.
| June 2026 | July 2026 |
| Sessions | 21 | 22 |
| Trades | 890 | 1,126 |
| Trades per session | 42.4 | 51.2 |
| Win rate | 67% | 62.4% |
| Profit factor | 2.48 | 1.75 |
| Average per trade | 0.242% | 0.153% |
| Average hold | 378s | 390s |
| Return on capital used | 10.2% | 8.2% |
| Maximum drawdown | 0.4% | 0.6% |
| Sessions in profit | 20 of 21 | 19 of 22 |
The ordering matters more than the numbers. June is where the idea was found, so June is not
evidence of anything. July was run once, afterwards, with nothing changed. That single run is the
only honest test in the table, and it came back weaker than June, which is what you would expect and
also what you would hope for.
3. What we already went after
The obvious suspicion is a few lucky names. It is not that. June traded 466 symbols and the three
best of them account for 9.7% of the total; July traded 532 and its top three account for 8.7%.
Removing them changes very little.
The shape of the edge is unglamorous. Winners average 0.605% in June against losers at 0.494%, and
in July it is 0.57% against 0.54%. That gap is thin. The result lives on the hit rate, not on the
size of the good trades, which also means it would not survive a win rate a few points lower.
Resampling the trade sequence puts June somewhere between 5,196 and 7,766 dollars against an actual
6,488, and July between 3,686 and 6,701 against 5,198. Both actuals sit inside their interval rather
than perched at the top of it.
One detail we noticed and cannot explain away as design: the two months needed almost exactly the
same capital, 63,468 dollars in June and 63,457 in July, with 21 positions open at the busiest
moment in both. Average concurrency was 7.96 and 9.66.
4. The part that bothers us
A 0.9% maximum drawdown across 7,137 trades is the number we do not believe yet.
There is an innocent explanation. Twenty-one positions, six minutes each, spread across five hundred
symbols is a lot of small independent bets, and that does flatten an equity curve. July's longest
losing streak was 14 trades and it still barely dented the total.
There is also a guilty explanation, which is that something in the accounting is too kind and we
have not found it. We have been through fill logic, costs, lookahead, position accounting,
overlapping positions and universe selection. Nothing has fallen out. That is not the same as
nothing being there.
The rest of what is unsettled is easier to state. Two months of per-trade detail is not seven. Our
fill rule is conservative but it is still a rule: an order we count as filled had a print at that
price, and a real one would also have needed to sit somewhere in a queue we cannot see. And none of
it has been traded with real money, so everything above is a reconstruction.
5. What you can do with it
It is yours to run. Your own recordings, your own sessions, your own machine, and no obligation to
tell us anything.
If you do feel like poking at it, the drawdown is the interesting place to start. Change the
position cap, change the capital, take it across a stretch we have not touched, and see whether the
curve stays this flat. We would rather one of you found the crack now than none of us found it later.
The fill assumptions are the other soft spot. If they hold up worse on your data than on ours, that
is worth more to all of us than another run that agrees.
And a run that goes nowhere is still a result. Those are the ones we would most like to hear about,
and there is nothing embarrassing about sending one.
6. What we ask, and what this is not
We do ask one thing in return. Keep the details inside this group: the conditions and settings sent
to you are not for posting, forwarding, screenshotting or describing elsewhere, and that includes
paraphrasing them somewhere public. A strategy of this kind stops working once enough people run it,
which is the whole reason for asking, and there is no polite way to dress that up. If you want to
talk about it with someone who is not in this group, talk about the fact that we are testing
something, not about what it does.
It also only runs on the one-second frame in our app. That is not a preference. Everything above was
measured on one-second recordings replayed through our engine, with fills decided against the
recorded quote and the printed tape, and the app is what produces and replays those recordings.
Minute bars are not a coarser view of the same thing. They are a different measurement, and a number
produced from them is not this number. If you run it on anything other than the one-second frame,
whatever you get back is not a test of this.
This is not investment advice. It is not a recommendation, not a solicitation, and not a managed
product. We are not telling anyone to trade it, and we are not going to tell you it works, because
we do not yet believe our own drawdown figure. TraderWe is a tool for measuring and testing, and
what we are handing over is an unfinished measurement. We may change it, we may find the flaw
ourselves next week, and we may drop it entirely. Whatever you do with it is your decision and your
risk, with money you can afford to be wrong with. Backtested results are a reconstruction of what a
rule would have done against recorded data, and every reconstruction carries assumptions that can be
wrong.
7. Sample accounting
The full test runs from January 2 to July 31, 2026, restricted to 09:30 to 11:00 ET, on one-second
recordings replayed through our own engine.
June and July come from the two retained result files, 21 and 22 sessions, with July drawing on 22
session files. Capital, drawdown and return are measured against the capital the schedule actually
required rather than an assumed account size.
Numbers in sections 2 and 3 are read straight out of those files. Section 1 is the total for the
full period as previously reported.
Thank you for being here early. This is the part of the work we would only hand to people who were.