Slippage is the difference between the price you expected and the price you actually
got. Everyone knows the definition. Almost nobody knows the size, and the size is what decides
whether a strategy makes money.
So we measured it. We took one model's 2,084 trades and re-priced every one of them under six
different fill assumptions, changing nothing else.
1. Where slippage comes from
Three sources, and they are not the same problem.
Source
What happens
When it bites
Crossing the spread
You buy at the ask and sell at the bid
Every single trade
Walking the book
Your order is bigger than the size at the touch
Larger orders, thin names
Latency
Price moves between your decision and your order arriving
Fast markets, slow connections
The first one is not really slippage in the strict sense — it is a known, quotable cost. But it is
usually the largest of the three, and it is the one most backtests silently skip by filling at the
mid or at the last trade price.
2. What it did to a real strategy
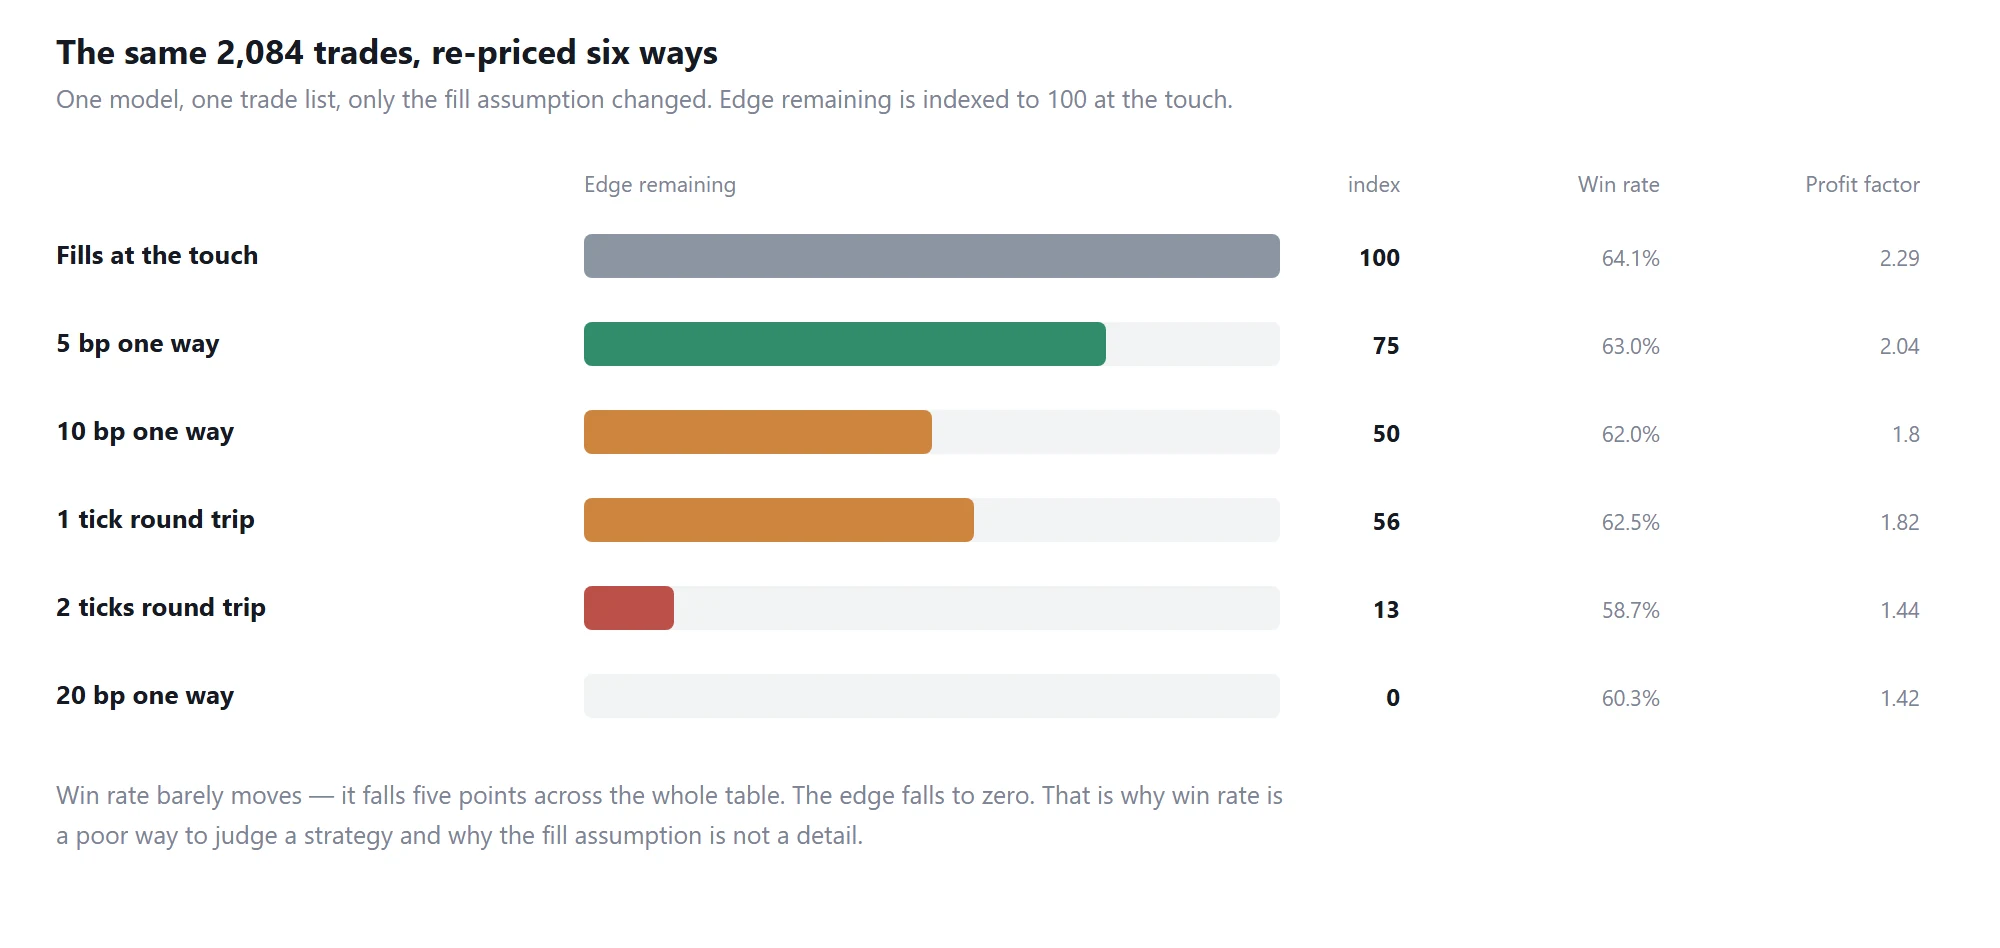
The same 2,084 trades re-priced under six slippage assumptions: edge remaining, win rate and profit factor
Read the "edge remaining" column. Fills at the touch are indexed to 100.
Cost assumption
Edge remaining
Win rate
Profit factor
Fills at the touch
100
64.1%
2.29
5 bp one way
75
63.0%
2.04
1 tick round trip
56
62.5%
1.82
10 bp one way
50
62.0%
1.80
2 ticks round trip
13
58.7%
1.44
20 bp one way
0
60.3%
1.42
One tick of round-trip slippage removed 44% of the edge. Two ticks removed 87%.
At 20 basis points one way, the edge is gone entirely. Not reduced — gone. And 20bp one way is not a
pessimistic assumption on this population; our separate measurement of what a $5,000 market order
actually pays in a $5–20 stock came out at 38bp one way
(what day trading a US stock really costs).
3. Why win rate hides it completely
Look at the win rate column again. Across the entire table it moves from 64.1% to 58.7% — about five
points. Meanwhile the edge goes from 100 to zero.
That is the single most useful thing in this article. Win rate is the statistic people quote, and it
is nearly blind to slippage. A strategy can keep winning the same proportion of the time while every
win gets smaller and every loss gets bigger, and the summary number you are watching barely twitches.
Profit factor moves more, but not proportionally either — 2.29 to 1.42 while the edge went to zero.
If you are judging a strategy by win rate, you cannot see the thing most likely to kill it.
4. Why one tick matters so much
Because a tick is not small relative to what a day trade is trying to earn. On a $2 stock, one cent
is 50 basis points. We measured that 32.2% of all quotes in this population were already sitting at
the minimum one-cent spread — meaning the spread cannot get any tighter, and on a low-priced name
that one cent is most of a typical target.
A strategy targeting 0.5% on a $1.50 stock is not aggressive. It is arithmetically impossible: one
cent alone is a 0.67% round trip there.
5. How to measure your own, instead of guessing
Guessing is the actual problem. Most backtests pick a fill assumption and never revisit it, and the
assumption is usually the most optimistic one available.
Record the book, not just the price. You cannot reconstruct what you would have paid from
candles. You need the ladder as it was at the moment of the fill.
Walk your own order against it. For a market buy of your real size, fill against ask levels one
through ten in order, take the quantity-weighted average, and compare it to the mid. That is your
one-way cost, and it is specific to your size and your symbols.
Re-run your strategy at three cost levels, not one. Optimistic, measured, and pessimistic. If the
result only survives the optimistic one, you have not found an edge — you have found a fill
assumption.
How to backtest a day trading strategy on US stocks walks through the recording side.
6. What to do about it
Target more, or trade less. Cost is fixed per round trip, so a larger target dilutes it. Going
from a 1.5% target to a 3.0% target on the same 2:1 structure moves your break-even win rate from
67% to 50%.
Put a spread filter in front of the entry. Not as a comment — as a condition that can reject the
trade. This liquidity filter is three lines and goes in front of anything.
Size to the book, not to the account. Our depth measurement found the quoted price is typically
good for only about $1,200 to $5,200 before you start walking
(order book depth measured).
Prefer windows where the cost is lower. It is not uniform through the day, and the difference is
larger than most people assume (the opening 30 minutes is the easiest day trading window).
7. The related mistake that is even more expensive
Slippage assumes you got the trade at all. A larger version of the same problem is a backtest fill on
a symbol you could never have been watching.
When we audited our own model against live subscription constraints, 82.2% of its fills turned out to
be trades we could not have taken — and those fills carried 48% of the profit
(82% of our backtest fills were trades we could not have taken live).
Price your fills honestly, then check that the fills were possible at all. In that order.
Originally published by TraderWe on August 17, 2026. You may quote and link to this page. Republishing the full text without a link back to the original is not permitted.
yeah the spread thing hits perps too, funding gets all the attention but i'm crossing the book every entry and exit and nobody's charting that. curious if the model here was doing anything intraday or holding longer, because the same cost eats a scalper alive and barely tickles a swing