Half the stocks on your day trading watchlist at 09:35 are gone by 10:00
By TraderWe· Published Aug 15, 2026· Updated Aug 17, 2026· 💬 4
Study details
Measured
2026-07-20 – 2026-07-31, 10 recorded sessions; 30-slot change-ranked universe
Instruments
US equities, intraday movers; 1,360 symbol-sessions
Method
read the recorded universe table, which stamps the symbols actually subscribed at each instant, and measure turnover, dwell time and how much of the 09:35 membership survives
Result
a median 140 symbols pass through 30 slots in a session, a turnover of 4.7 times. Of the symbols present at 09:35, 57% remain at 10:00 and 33% at the close
A backtest usually starts with a file and a question: does this rule make money on this data? The file feels like a fixed thing. It is not. Somebody chose which symbols went into it, and on a day trading strategy that choice is made hundreds of times a day, while the session is running.
We wanted a number for how fast that choice changes. So we measured it on our own recordings.
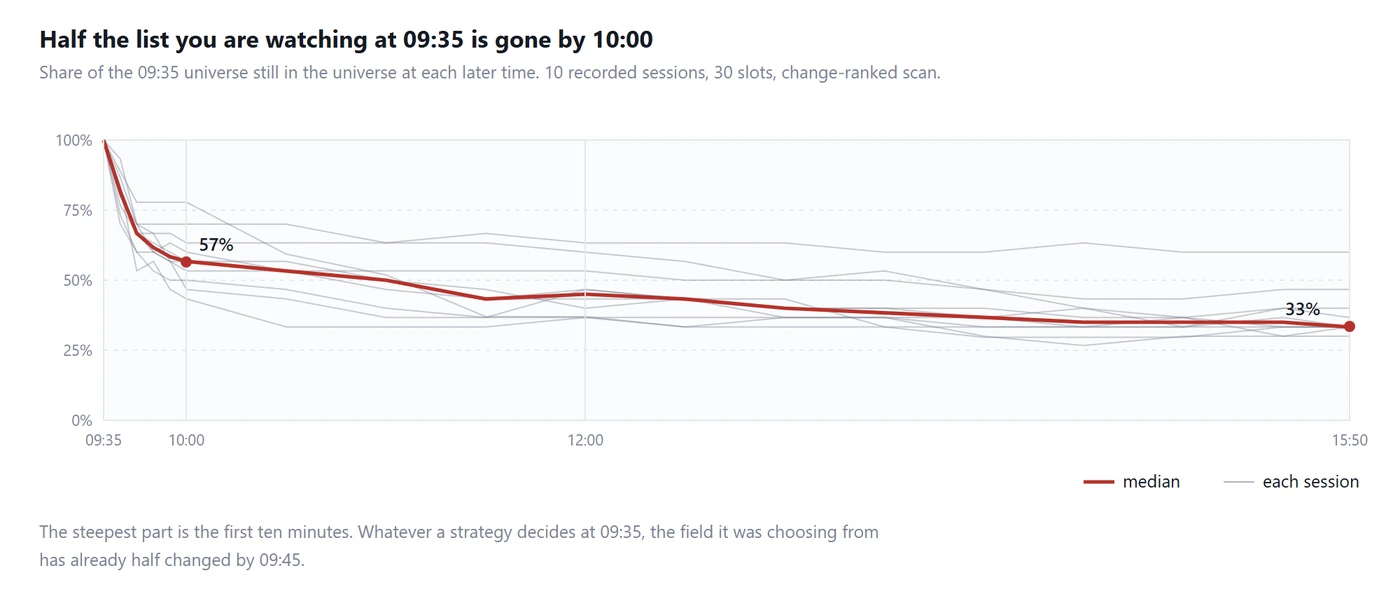
The short version: a 30-slot watchlist ranked by change percent has about 140 different symbols pass through it in a single session, and only a third of the names present at 09:35 are still there at the close. Half are gone within twenty-five minutes.
1. What we measured
Our recorder writes a universe table alongside the tick data. Each row is a timestamped snapshot of the symbols actually subscribed at that instant — what the scanner had selected, plus anything held as a position. It is written by the same code path that drives the live subscription, so it is a record of what the strategy could see, not a reconstruction of what it should have seen.
Ten recorded sessions qualify: 2026-07-20 through 2026-07-31, all with a 30-slot universe ranked by change percent. Each session holds between 823 and 1,440 snapshots.
Session
Snapshots
Symbols through the universe
Turnover
2026-07-20
1,440
124
4.1×
2026-07-21
1,435
150
5.0×
2026-07-22
1,436
150
5.0×
2026-07-23
1,435
109
3.6×
2026-07-24
1,437
155
5.2×
2026-07-27
1,419
160
5.3×
2026-07-28
1,417
154
5.1×
2026-07-29
1,435
118
3.9×
2026-07-30
1,249
110
3.7×
2026-07-31
823
131
4.4×
Median 140 symbols through 30 slots, a turnover of 4.7 times. The quietest session still cycled 3.6 times through its slots.
2. Half the list is gone within twenty-five minutes
Take the set of symbols in the universe at 09:35 and ask, at each later moment, how many of them are still in it.
Share of the 09:35 universe still present later in the session, 10 recorded sessions
Time
Still in the universe
09:40
82%
09:45
67%
10:00
57%
11:00
50%
12:00
45%
14:00
37%
15:50
33%
The decay is front-loaded and then almost flat. Within ten minutes a third of the list has been replaced. By 10:00 it is nearly half. After about 11:00 the remaining names mostly stay, and the curve settles into a slow drift down to a third.
That shape is consistent across all ten sessions — the individual session lines in the chart sit in a band from 30% to 60% at the close, and every one of them has the same steep opening drop.
3. It is two populations, not one
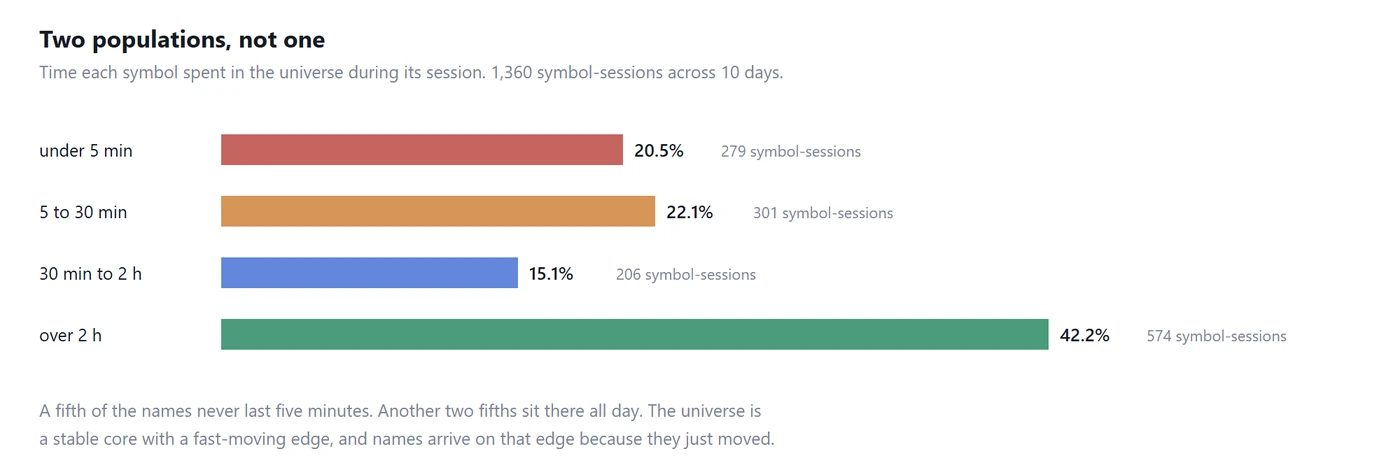
The turnover number on its own suggests constant churn. The dwell times say something more specific.
Distribution of how long each symbol stayed in the universe
How long a symbol stayed
Share
Under 5 minutes
20.5%
5 to 30 minutes
22.1%
30 minutes to 2 hours
15.1%
Over 2 hours
42.2%
Across 1,360 symbol-sessions the median dwell is 59 minutes, but the distribution is not centred there at all. Two fifths of the names hold a slot for more than two hours. A fifth never last five minutes.
So the universe is a stable core plus a fast-moving edge. And the edge is not noise: a change-ranked scanner admits a symbol precisely because its change percent just crossed into the top thirty. Names arrive on the edge because they just moved. That is the selection rule doing exactly what it was asked to do.
The flicker is worth its own line. The median symbol enters the universe twice in a session rather than once. It qualifies, drops out, and qualifies again. Only 49% of symbols appear in a single unbroken stint.
4. When symbols arrive
First appearance
Share of symbols
Before 09:30
24%
09:30 to 10:00
47%
10:00 to 12:00
17%
12:00 to 14:00
7%
14:00 to 16:00
5%
Nearly half of every session's symbols enter the universe in the first thirty minutes of regular trading. That is the same half hour where spreads are widest and where most day trading strategies are written to operate.
5. Why this breaks a backtest
Here is the practical consequence, and it is the reason we ran the measurement.
A recording contains every symbol that was in the universe at any point during the day — 140 of them in a typical session. A backtest that evaluates a strategy against every table in that file is letting it choose from 140 candidates at every instant. Live, it had 30, and a specific 30 that changed all day.
The two are not close. And the error does not average out, because the symbols that join late are not a random sample. They join after moving. A backtest with unrestricted access to the file spends the session picking names that already went up, and the resulting equity curve looks like skill.
We have published the size of that effect from the other direction before: 82% of our backtest fills were trades we could not have taken live. This measurement is the mechanism behind that number.
The fix is not complicated. The membership is recorded, so a strategy can be gated on it:
if InUniverse and Price > Sma(60):
    Buy()
One condition, and the backtest is restricted to the same field the live engine had.
6. What it means for a strategy
Your slot count is a real constraint, not a setting. Thirty slots against 140 daily candidates means the scanner is discarding roughly three of every four names it considers. Whatever your entry rule is, it only ever sees what survived that filter.
A watchlist built at 09:35 is stale by 09:45. Any workflow that picks names in the first minutes and then trades them for the rest of the day is trading a list the market has already moved past. Half of it, within ten minutes.
Late entrants deserve suspicion. A symbol arriving at 14:00 has already made the move that got it ranked. That is not a reason to avoid it, but it is a reason not to treat "it just appeared on the list" as a bullish signal in itself.
Backtest and live must use the same membership. This is the one that costs real money. Everything else here is context.
7. How we measured it, and what it does not cover
The definition, exactly. Each universe row records the symbols subscribed at that instant, semicolon separated, timestamped in Eastern time. Survival at time t is the count of symbols present at both 09:35 and t, divided by the count present at 09:35. Dwell is the summed time a symbol was present, with gaps between snapshots capped at 120 seconds so that a pause in recording cannot inflate it. Turnover is distinct symbols seen in the session divided by the median universe size.
Ten sessions, over two weeks, in one market. This is not a long study. The consistency across the ten is good, but two weeks in July 2026 is two weeks in July 2026.
One scanner configuration. Thirty slots, ranked by change percent, with our price band and turnover floor. A turnover-ranked scan would churn far less, because turnover leaders are large and stable while change leaders are small and violent. A 50-slot universe would churn differently again. The shape of the finding should carry; the specific percentages belong to this configuration.
One data feed. The rankings come from one broker's view of the market. Another vendor's movers list would not be identical.
We could not run this on our full archive. We hold 264 recorded sessions, but 251 of them were recorded against a fixed watchlist rather than a rotating scanner — in those files the universe never changes, so there is nothing to measure. That is a limitation of what we recorded, not of the market, and it is why this study is ten sessions rather than two hundred.
If you want to reproduce it on your own recordings, the universe table is in every per-second file, and the factor reference explains InUniverse. The US stock backtest walkthrough covers the recording side.
Originally published by TraderWe on August 15, 2026. You may quote and link to this page. Republishing the full text without a link back to the original is not permitted.
Been saying for years that the list is the strategy, not the entry rule, and this is the first time I've seen somebody actually count the churn instead of guessing at it. Back in the pit days your 'watchlist' was whatever the guy next to you was yelling about, and it turned over just as fast, we just didn't have a table to prove it. What I'd want to know is whether the names that survive to the close are a different animal entirely, or just the same lottery with a longer ticket. Stay humble.
The bit I want spelled out: if a symbol only sits in the universe for a short stretch, then a backtest on a fixed file is quietly assuming you'd have held attention you never actually had. That changes how I'd size, because dwell time is basically the ceiling on how long a position can be managed by the same signal.
funny reading this at 3am when my crypto list barely moves all night, whole different rhythm. would love to see the same turnover count on a 24h market, i bet the slots recycle way less outside the open.
Ok so honest question because I'm confused - if I train a model on a saved list of movers, am I basically training on names that were only selected because they already moved? Feels like the label and the selection are tangled and I don't know how you'd untangle that.