A moving average crossover strategy that tests the crossing rather than the state. `Price >
Sma(60)` stays true for as long as price is above the average, so an entry written that way fires
on the hundredth tick as readily as the first. If you mean the crossing, say so.
1. The rule
# BUY — the tick where it actually crosses
if Price > Sma(60) and PriceN(1) <= Sma(60, 1):
    if DayAmount > 10000000 and Strength > 110:
        Buy()
# SELL
if ProfitPct >= 1.5 or ProfitPct <= -0.8 or HoldTime >= 1200:
Sell()
2. State versus crossing
This is the difference the whole strategy turns on.
Written as
Means
Fires
Price > Sma(60)
price is above the average
every tick, for as long as it stays above
Price > Sma(60) and PriceN(1) <= Sma(60, 1)
price just crossed above
once, on the tick it crosses
PriceN(1) is the price one tick back. Sma(60, 1) is the same 60-period average one tick back —
the second argument shifts the window backwards. Comparing the previous price against the
previous average is what makes it a crossing rather than a state.
Run the version without that second condition and compare the number of entries. The difference
is entirely trades taken in the middle of a move you already missed, which is the most expensive
kind of late entry: the move has already happened, and you are paying the spread for the part
that is left.
3. Why the two filters
DayAmount > 10000000 requires ten million dollars traded so far today. A crossover on a name
that has traded eighty thousand dollars is noise — the average is being dragged around by a
handful of prints.
Strength > 110 is cumulative buy volume over cumulative sell volume times 100, so above 100
means buyers have been paying up on balance. A crossing that happens while sellers are in control
is usually the last twitch before the move continues down.
4. When this works and when it does not
Crossovers work when there is a trend to catch. On a range-bound day the price crosses a 60-period
average repeatedly, each crossing looks identical to the code, and you take every one of them.
That is the classic way a moving average trading strategy loses money: not wrong entries, but too
many entries in conditions where no version of the entry has an edge.
The honest fix is not a better average. It is a condition that says do nothing — see
market regime filter: when a trading strategy should do nothing.
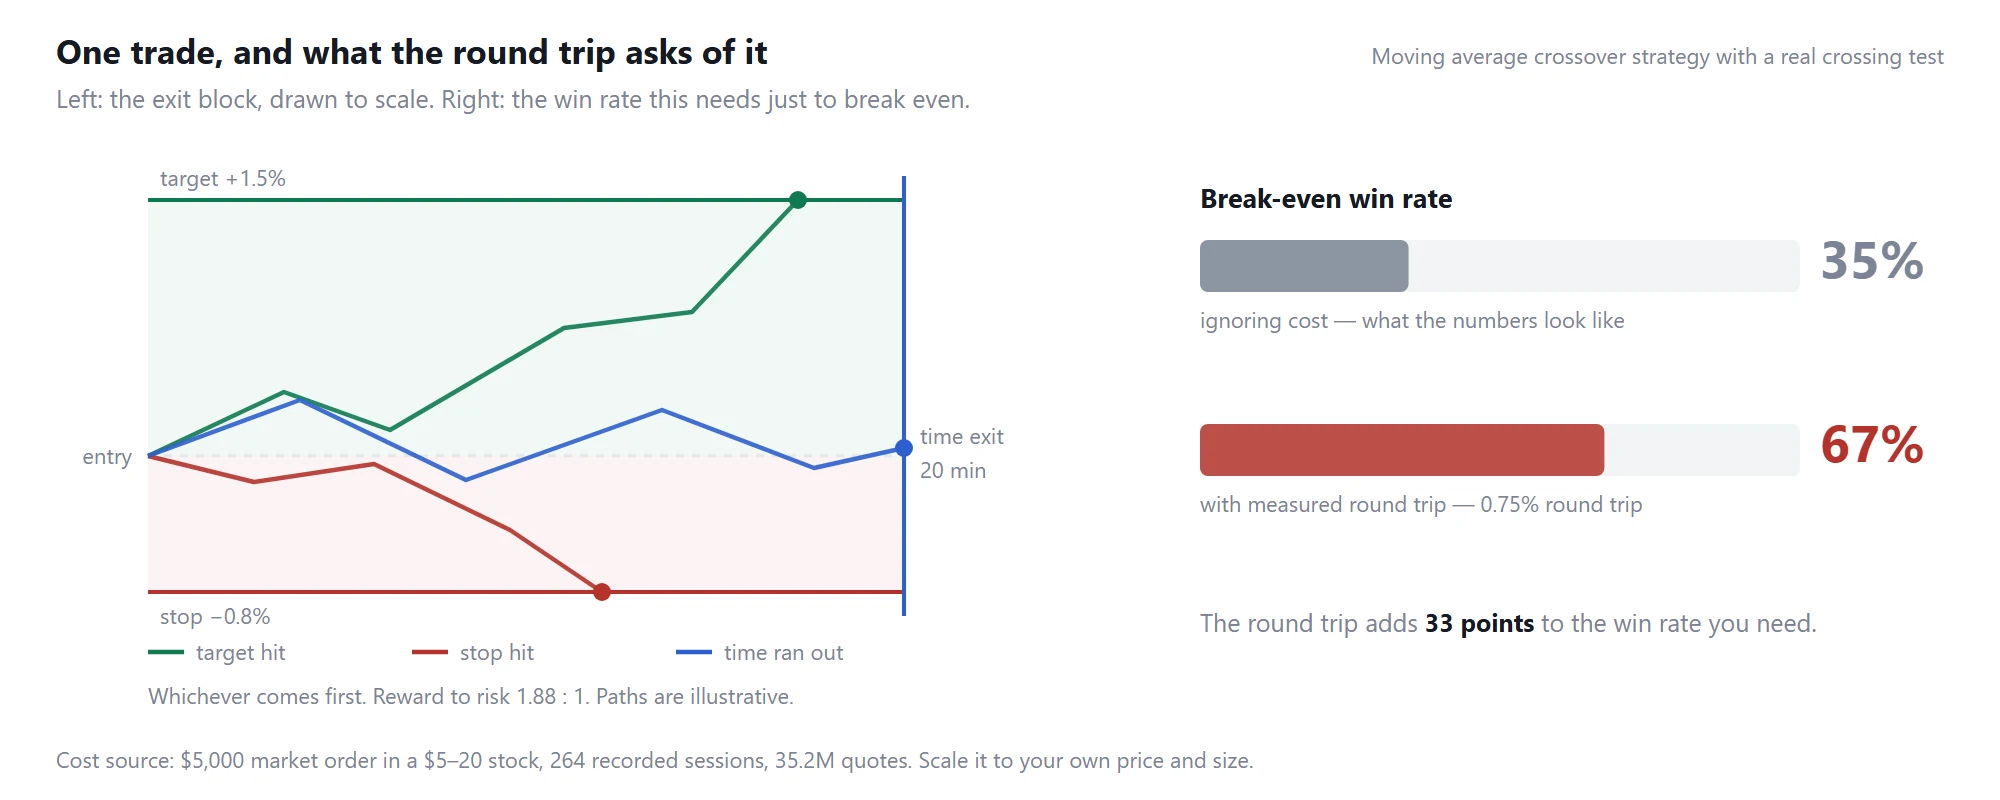
Moving average crossover: the exit block drawn to scale, and the break-even win rate before and after measured trading costs
The 1.5% / 0.8% structure needs a 35% win rate ignoring cost and 67% with the measured 0.75%
round trip. Thirty-three points.
This is worth holding next to section 2. Testing the crossing rather than the state cuts the number
of entries sharply, and every entry you avoid is a round trip you do not pay. On a strategy that
needs 67% to break even, not taking a marginal trade is worth more than winning one. See
what day trading a US stock really costs.
Educational template for research and backtesting. Not investment advice and not a signal service.
Originally published by TraderWe on August 13, 2026. You may quote and link to this page. Republishing the full text without a link back to the original is not permitted.
i learned this one the dumb way. Had a state condition running on a 1s timeframe and it just kept re-entering the same move all afternoon until my average price was garbage. the fill count was the first clue something was wrong, not the pnl.
good writeup, but the crossing test only fixes how often you get in. It doesn't cap what happens after. one entry per cross still means N crosses per day, so add a max-entries-per-symbol line and a daily stop before you run this live. my checklist for anything intraday: max concurrent positions, max entries per name, daily loss cutoff. all three, not two of three.